

Question: Please HELP Me solve this! (question 4 asks for a chart, that chart must also be included in the word document): 1. Which of the
Please HELP Me solve this!
(question 4 asks for a chart, that chart must also be included in the word document):
1. Which of the sections has the highest average (mean) age? Provide that average and the average for each of the other sections. What is the Standard Deviation for the section with the highest mean?
2. Which of the sections has the highest median age? Provide that median and the median for each of the other sections. Which is a "better" average, and why?
3. Find a significant descriptive statistical difference between the different sections and describe it. How might it be useful in deciding how to teach that class differently?
4. What is the most common car brand in Section 002? Create a column chart showing the number of owners of each car brand in Section 002. Include the chart in your submission, and include the "none" category in your data.
Here is the data from the file
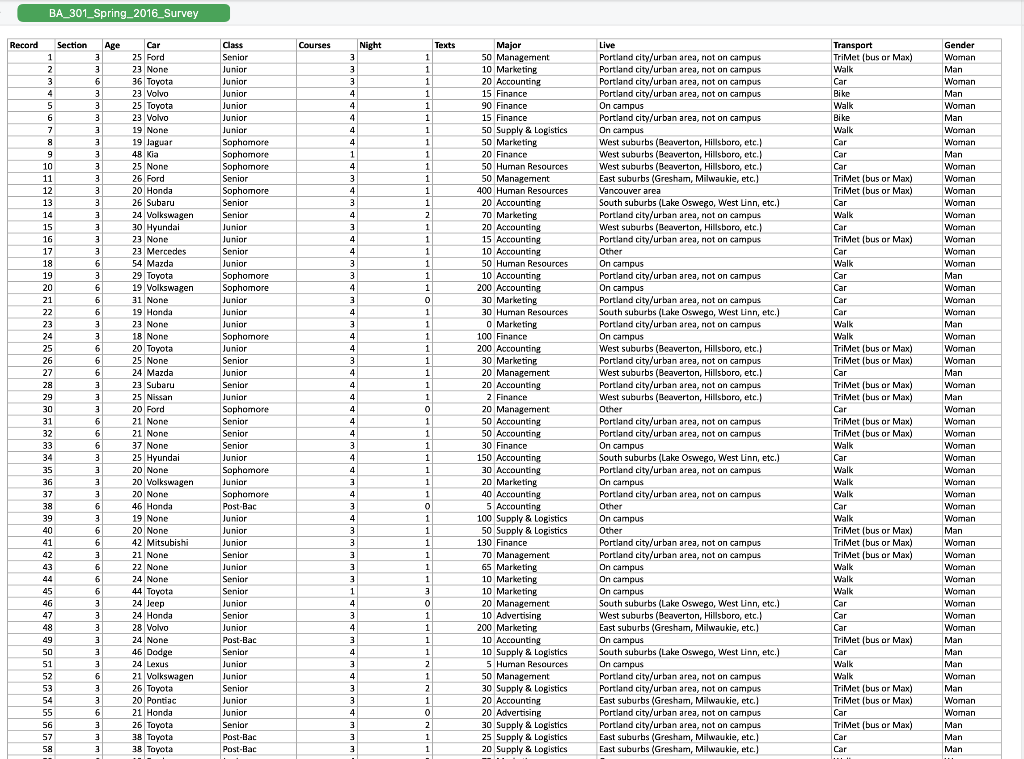
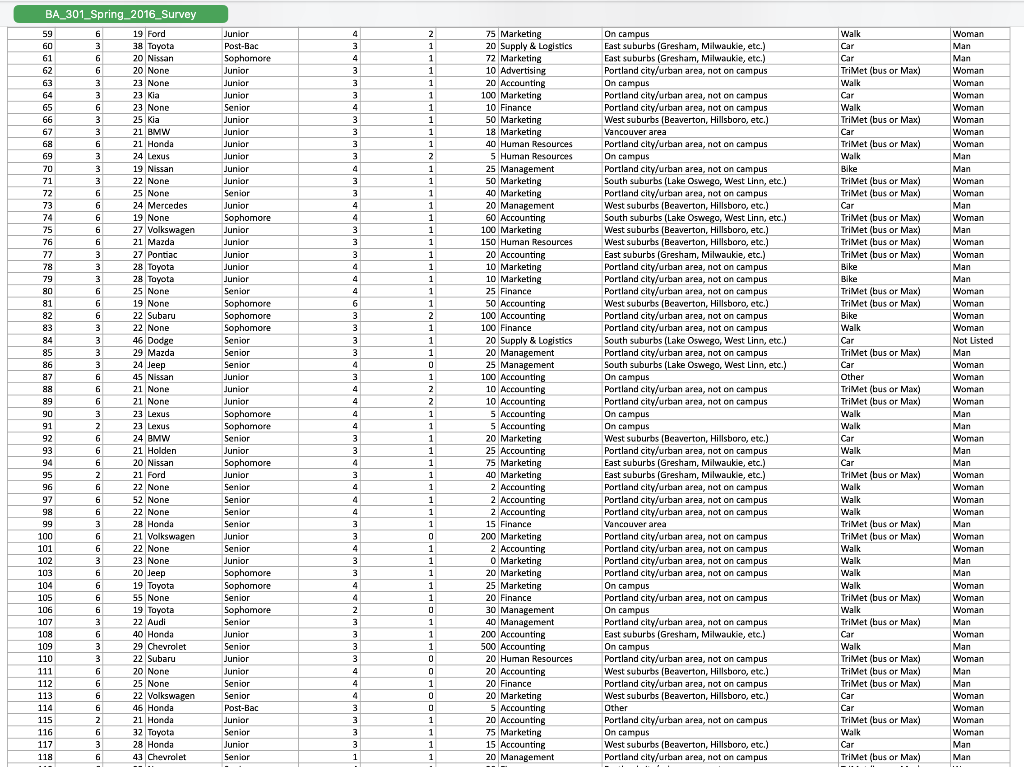
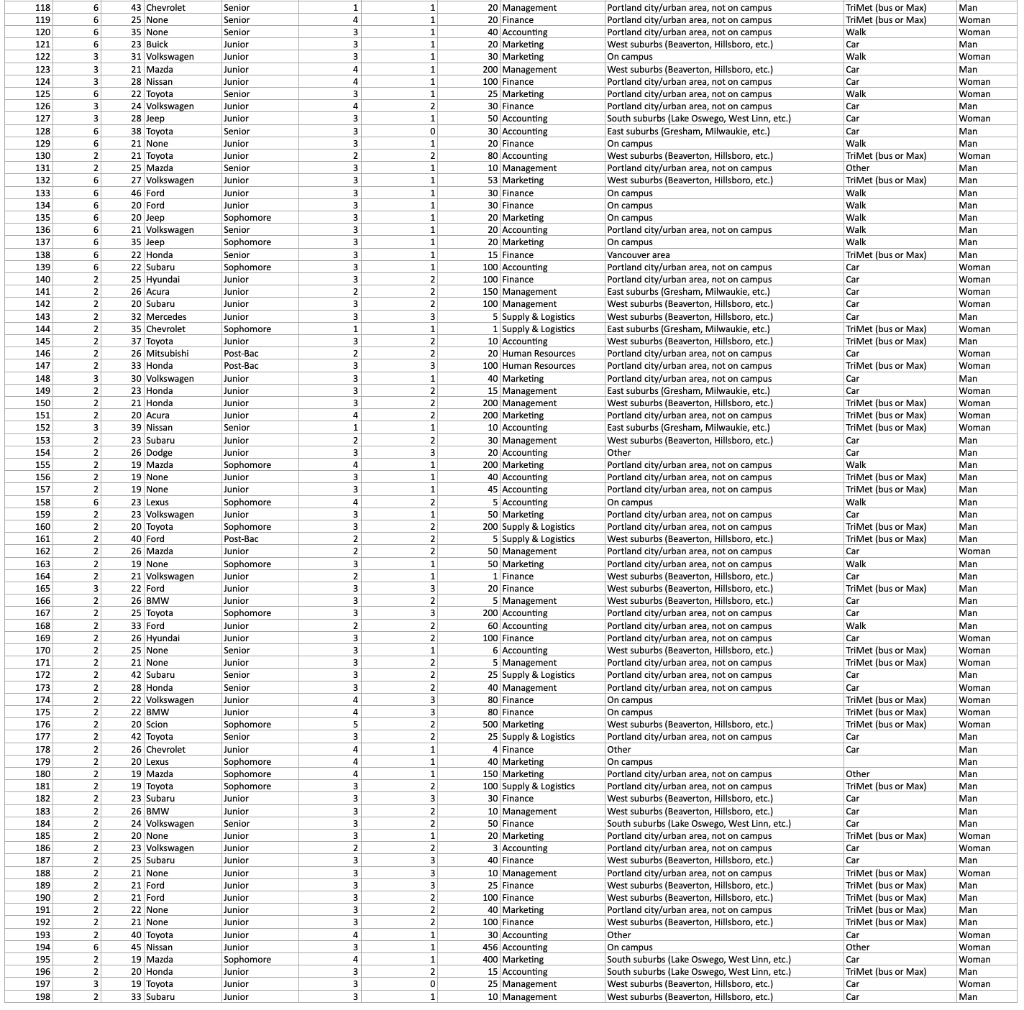
BA_301_Spring_2016_Survey BA_301_Spring_2016_Survey
Step by Step Solution
There are 3 Steps involved in it

Get step-by-step solutions from verified subject matter experts