

Question: Please help me solve this question. From a process known to be in control 6 samples of 3 units each were taken at random intervals
Please help me solve this question. 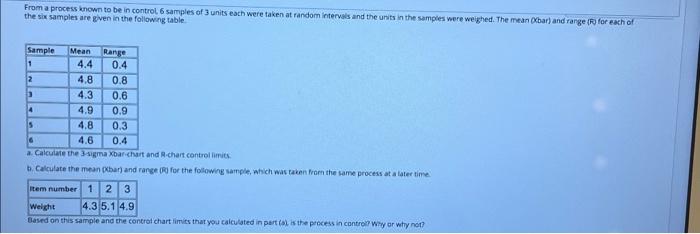
From a process known to be in control 6 samples of 3 units each were taken at random intervals and the units in the samples were weighed. The mean (bar) and range for each of the six samples are given in the following table 0.8 op Sample Mean Range 11 4.4 0.4 2 4,8 4.3 0.6 4 4.9 0.9 S 4.8 0.3 6 4.6 0.4 a. Calculate the ima barchart and R.chart controllis b. Calculate the mean bar) and range for the following sample, which was taken from the same process at a later time item number 12 3 Weight 4.3 5.1 4.9 Based on this sample and the control chartimies that you calculated in partial is the process in control Wy or why not Step by Step Solution
There are 3 Steps involved in it
1 Expert Approved Answer
Step: 1 Unlock

Question Please help me solve this question From a process known to be in con... View full answer
Question Has Been Solved by an Expert!
Get step-by-step solutions from verified subject matter experts
Step: 2 Unlock
Step: 3 Unlock