

Question: Please help me solve this question:- Question # 1: In the graph below, the vertical distance between points A and B represents a tax in
Please help me solve this question:-
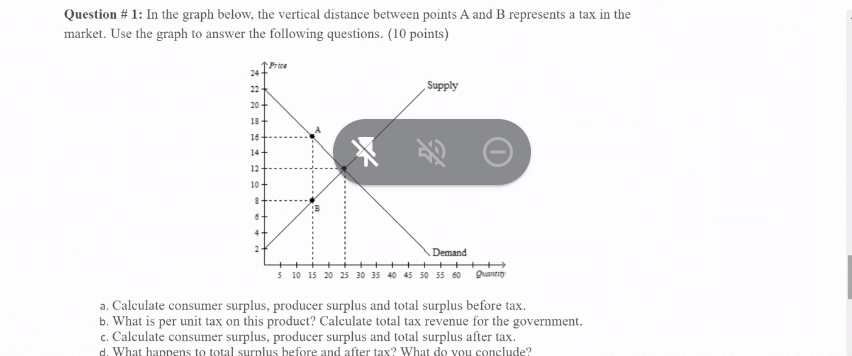
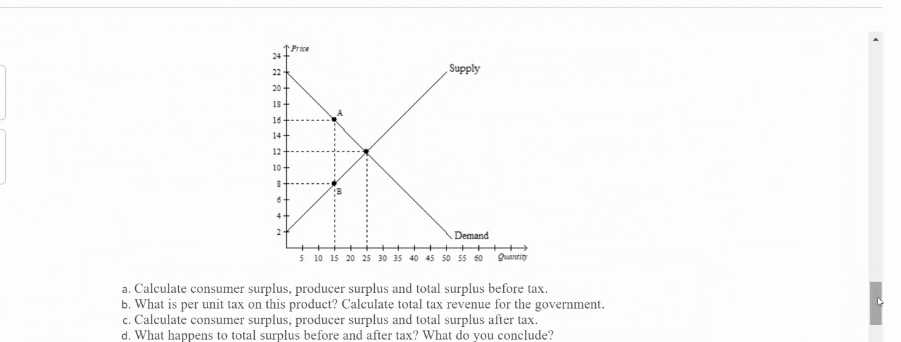
Question # 1: In the graph below, the vertical distance between points A and B represents a tax in the market. Use the graph to answer the following questions. (10 points) 24 Price 22 - Supply 20 16 +- - 14 12 + 10-+ Demand 5 10 15 20 25 30 35 40 45 50 55 60 Quantig a. Calculate consumer surplus, producer surplus and total surplus before tax. b. What is per unit tax on this product? Calculate total tax revenue for the government. c. Calculate consumer surplus, producer surplus and total surplus after tax. d. What happens to total surplus before and after tax? What do you conclude?24 Price 22 + Supply 20 + 18- A 14+ 10+ s+- Demand 5 10 15 20 25 30 35 40 45 50 55 60 Quantity a. Calculate consumer surplus, producer surplus and total surplus before tax. b. What is per unit tax on this product? Calculate total tax revenue for the government. c. Calculate consumer surplus, producer surplus and total surplus after tax. d. What happens to total surplus before and after tax? What do you conclude
Step by Step Solution
There are 3 Steps involved in it

Get step-by-step solutions from verified subject matter experts