

Question: Please help me solve through excel formulas and show all formulas Use the data below to complete StudentSocial Media Platform1 Google+2 YouTube3Snapchat4YouTube5Twitter6Snapchat7Whatsapp8Twitter9YouTube10Facebook11Pinterest12Snapchat13Whatsapp14Facebook15Facebook16Facebook17Whatsapp18Snapchat19Snapchat20YouTube21Twitter22Whatsapp23Whatsapp24Snapchat25Instagram26 Facebook27 Instagram28 Twitter29
Please help me solve through excel formulas and show all formulas Use the data below to complete StudentSocial Media Platform1 Google+2 YouTube3Snapchat4YouTube5Twitter6Snapchat7Whatsapp8Twitter9YouTube10Facebook11Pinterest12Snapchat13Whatsapp14Facebook15Facebook16Facebook17Whatsapp18Snapchat19Snapchat20YouTube21Twitter22Whatsapp23Whatsapp24Snapchat25Instagram26 Facebook27 Instagram28 Twitter29 Pinterest30 YouTube31 Facebook32 Instagram33 snapchat34 Whatsapp35 Twitter36 instagram37 Google+38 YouTube39 Twitter40 Facebook41 Twitter42 Facebook43 Snapchat44 Instagram45Snapchat46 Twitter47Twitter48Snapchat49Snapchat50Facebook51Twitter52Whatsapp53Facebook54Facebook55Whatsapp56Snapchat57Snapchat58facebook59Twitter60Snapchat61Google+62Snapchat63YouTube64Facebook65Google+66Facebook67Snapchat68Whatsapp69Google+70Pinterest71Whatsapp72YouTube73Snapchat74twitter75Whatsapp76Instagram77Twitter78Facebook79Twitter80Facebook81Pinterest82Snapchat83Facebook84Facebook85Whatsapp86Twitter87Facebook88Whatsapp89Facebook90Whatsapp
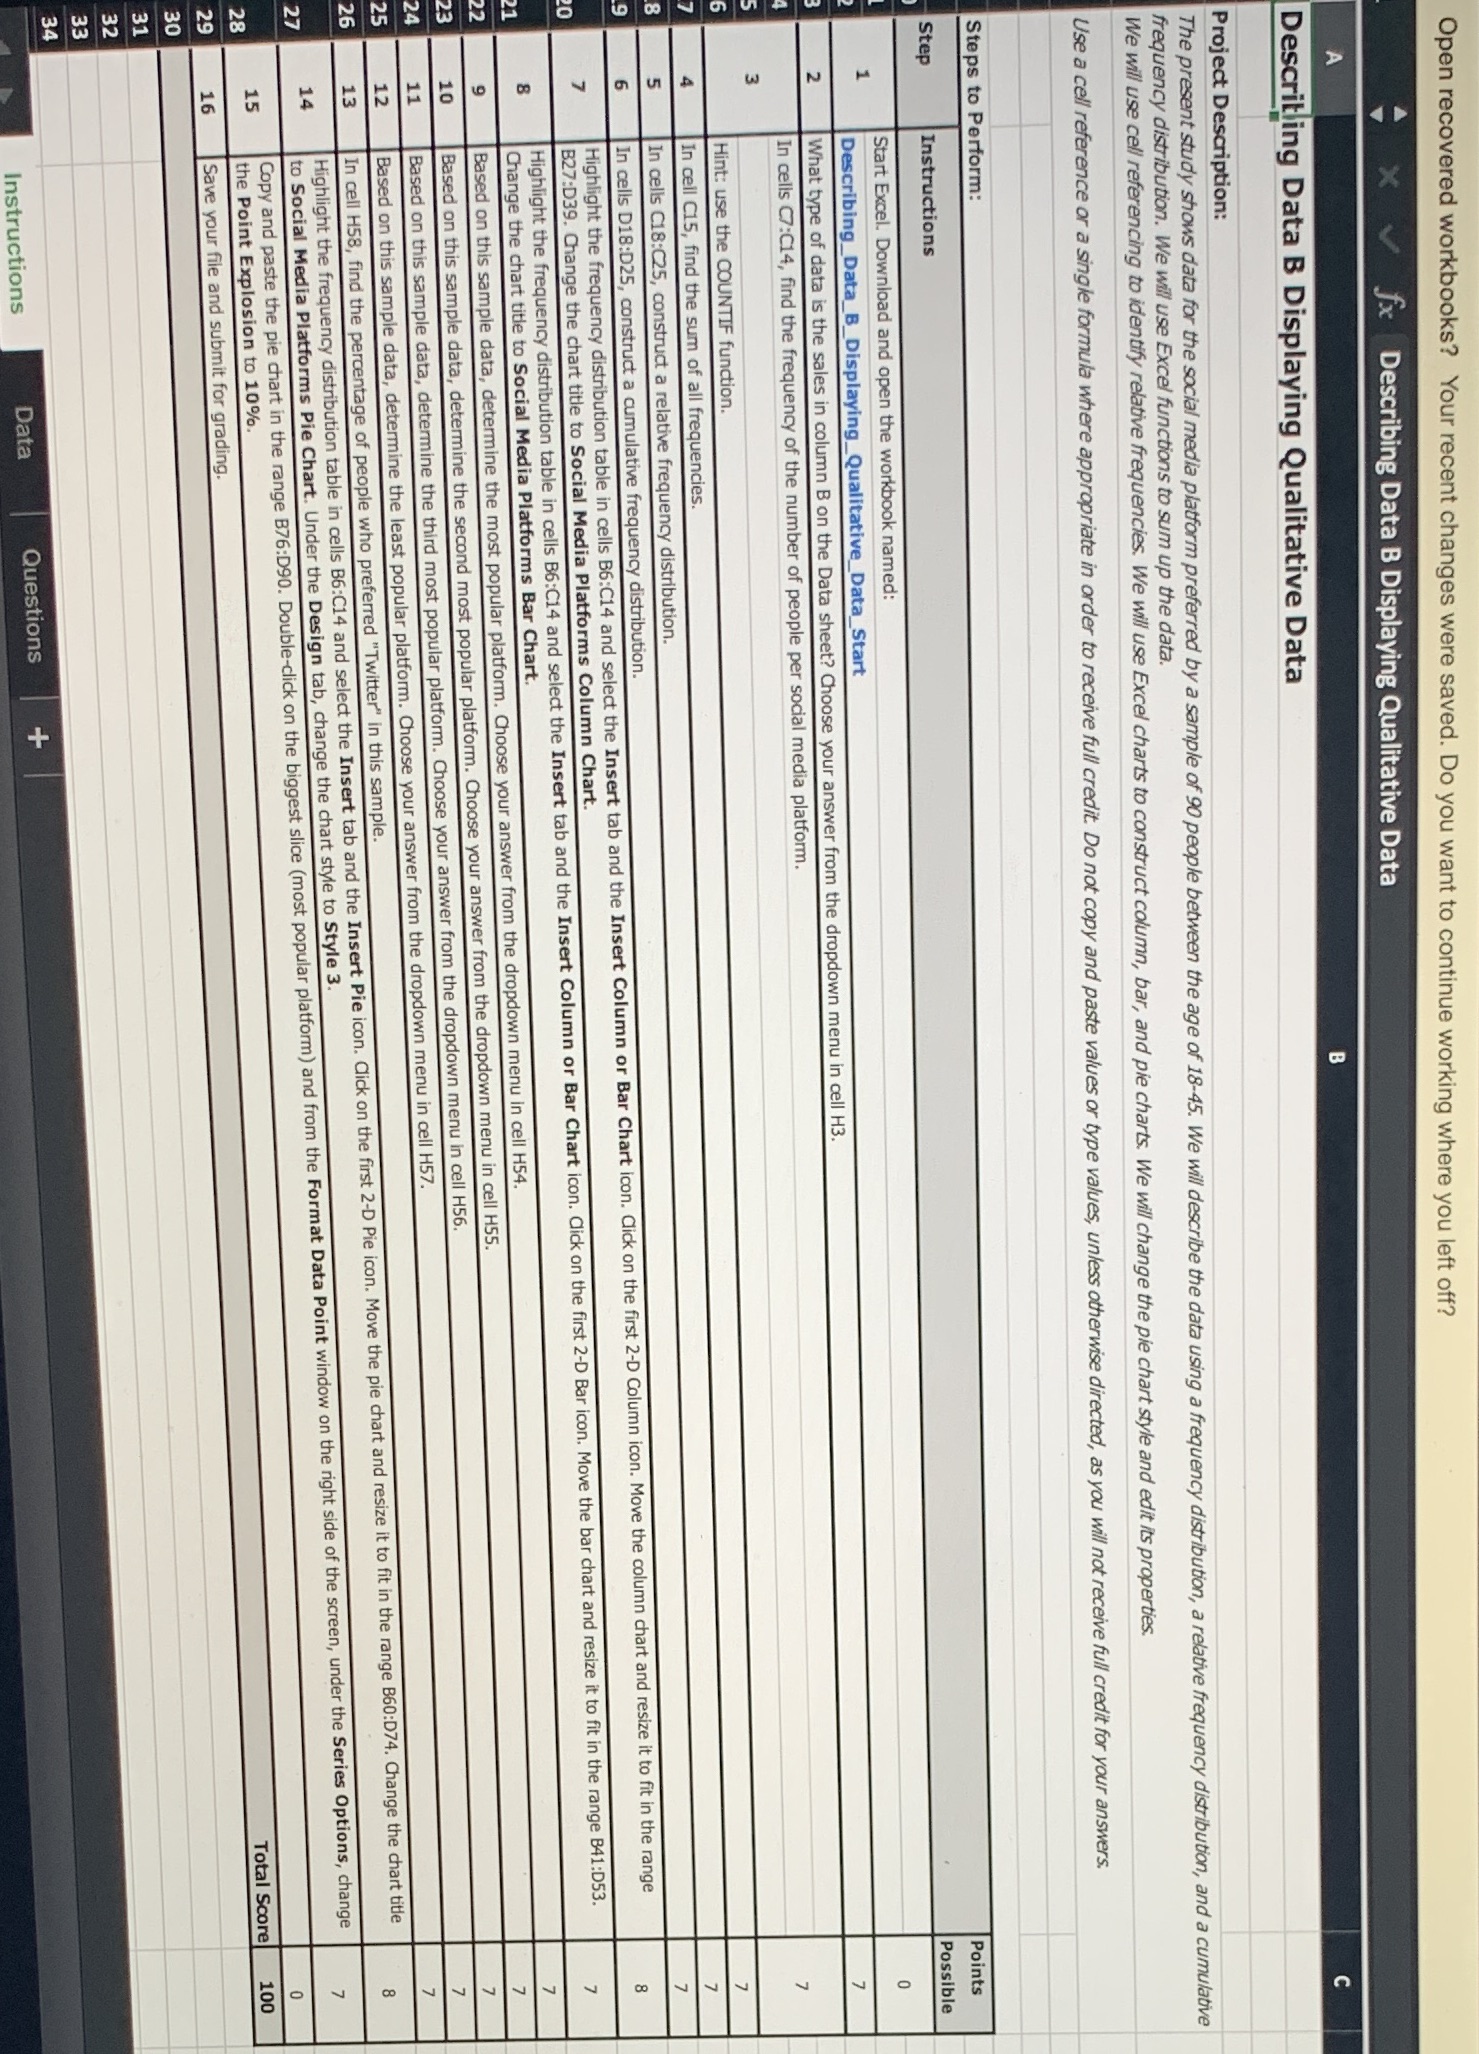
Open recovered workbooks? Your recent changes were saved. Do you want to continue working where you left off? x V fx Describing Data B Displaying Qualitative Data Describing Data B Displaying Qualitative Data Project Description: The present study shows data for the social media platform preferred by a sample of 90 people between the age of 18-45. We will describe the data using a frequency distribution, a relative frequency distribution, and a cumulative frequency distribution. We will use Excel functions to sum up the data. We will use cell referencing to identify relative frequencies. We will use Excel charts to construct column, bar, and pie charts. We will change the pie chart style and edit its properties. Use a cell reference or a single formula where appropriate in order to receive full credit. Do not copy and paste values or type values, unless otherwise directed, as you will not receive full credit for your answers. Steps to Perform: Step Instructions Points Start Excel. Download and open the workbook named: Possible Describing_Data_B_Displaying_Qualitative_Data_Start N What type of data is the sales in column B on the Data sheet? Choose your answer from the dropdown menu in cell H3. In cells C7:C14, find the frequency of the number of people per social media platform. M Hint: use the COUNTIF function. In cell C15, find the sum of all frequencies. In cells C18:025, construct a relative frequency distribution. In cells D18:D25, construct a cumulative frequency distribution. Highlight the frequency distribution table in cells B6:C14 and select the Insert tab and the Insert Column or Bar Chart icon. Click on the first 2-D Column icon. Move the column chart and resize it to fit in the range B27:D39. Change the chart title to Social Media Platforms Column Chart. Highlight the frequency distribution table in cells B6:C14 and select the Insert tab and the Insert Column or Bar Chart icon. Click on the first 2-D Bar icon. Move the bar chart and resize it to fit in the range B41:D53. Change the chart title to Social Media Platforms Bar Chart. Based on this sample data, determine the most popular platform. Choose your answer from the dropdown menu in cell H54. Based on this sample data, determine the d most popular platform. Choose your answer from the dropdown menu in cell H55. Based on this sample data, determine the third most popular platform. Choose your answer the dropdown menu in cell H56. Based on this sample data, determine the least popular platform. Choose your answer from the dropdown menu in cell H57. cell H58, find the percentage of people who preferred "Twitter" in this sample. Highlight the frequency distribution table in cells B6:C14 and select the Insert tab and the Insert Pie icon. Click on the first 2-D Pie icon. Move the pie chart and resize it to fit in the range B60:D74. Change the chart title to Social Media Platforms Pie Chart. Under the Design tab, change the chart style to Style 3. Copy and paste the pie chart in the range B76:D90. Double-click on the biggest slice (most popular platform) and from the Format Data Point window on the right side of the screen, under the Series Options, change the Point Explosion to 10%. 0 Save your file and submit for grading. Total Score 100 Instructions Data Questions +
Step by Step Solution
There are 3 Steps involved in it

Get step-by-step solutions from verified subject matter experts