

Question: PLEASE HELP ME SOON!!!! Question 1: THE DIRECT LABOR COST CASE [10 points) An accountant wishes to predict direct labor cost (y in hundreds of
PLEASE HELP ME SOON!!!!
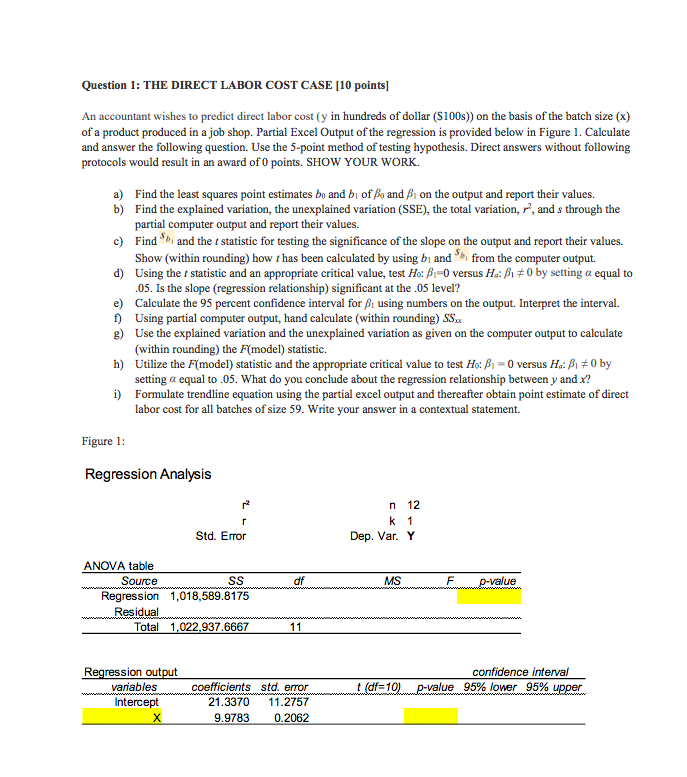
Question 1: THE DIRECT LABOR COST CASE [10 points) An accountant wishes to predict direct labor cost (y in hundreds of dollar (S100s)) on the basis of the batch size (x) of a product produced in a job shop. Partial Excel Output of the regression is provided below in Figure 1. Calculate and answer the following question. Use the 5-point method of testing hypothesis. Direct answers without following protocols would result in an award of O points. SHOW YOUR WORK. a) Find the least squares point estimates bo and bi of Bo and B. on the output and report their values. b) Find the explained variation, the unexplained variation (SSE), the total variation, r, and s through the partial computer output and report their values. c) Find and the statistic for testing the significance of the slope on the output and report their values. Show (within rounding) how has been calculated by using b, and from the computer output. d) Using the statistic and an appropriate critical value, test Ho: Bi=0 versus H.: B170 by setting a equal to .05. Is the slope (regression relationship) significant at the .05 level? e) Calculate the 95 percent confidence interval for Busing numbers on the output. Interpret the interval. 1) Using partial computer output, hand calculate (within rounding) SS. g) Use the explained variation and the unexplained variation as given on the computer output to calculate (within rounding) the F(model) statistic. h) Utilize the F(model) statistic and the appropriate critical value to test Ho: B1 = 0 versus H.:B10 by setting a equal to .05. What do you conclude about the regression relationship between y and x? i) Formulate trendline equation using the partial excel output and thereafter obtain point estimate of direct labor cost for all batches of size 59. Write your answer in a contextual statement. Figure 1: Regression Analysis n 12 k 1 Dep. Var. Y Std. Error df MS. F p-value ANOVA table Source SS Regression 1,018,589.8175 Residual Total 1,022,937.6667 Regression output vaniables. Intercept confidence interval (df=10).... p-value 95% lower 95% upper t coefficients std. error 21.3370 11.2757 9.9783 0.2062
Step by Step Solution
There are 3 Steps involved in it

Get step-by-step solutions from verified subject matter experts