

Question: please help me step-by-step to resolve this question I'm very lost. If more information is needed I'll be happy to post it, thanks. PROJECT STEPS
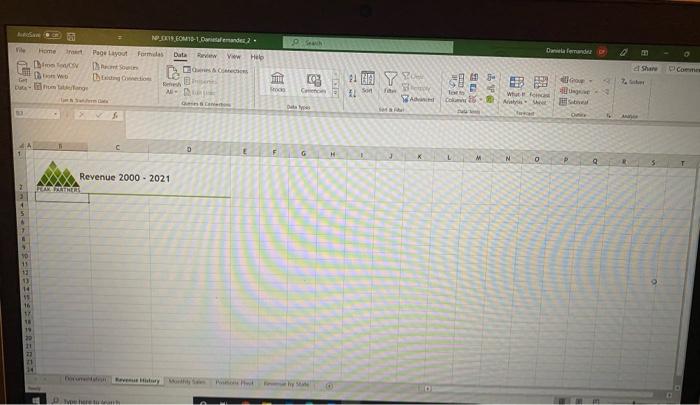
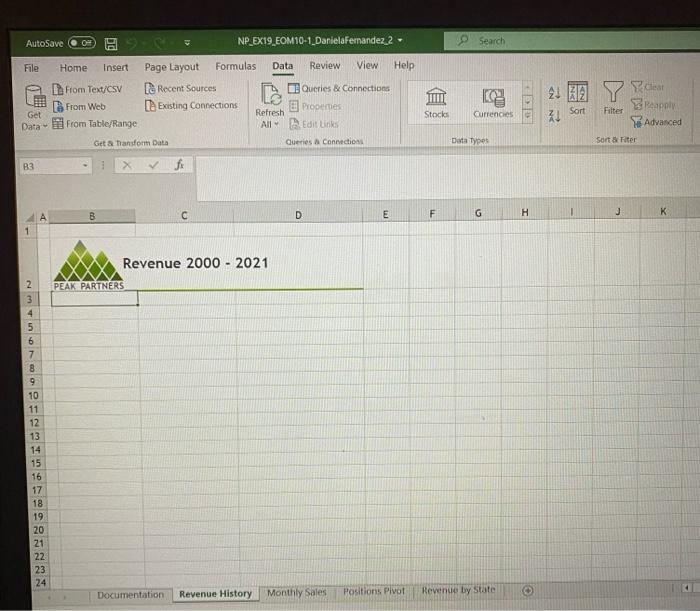
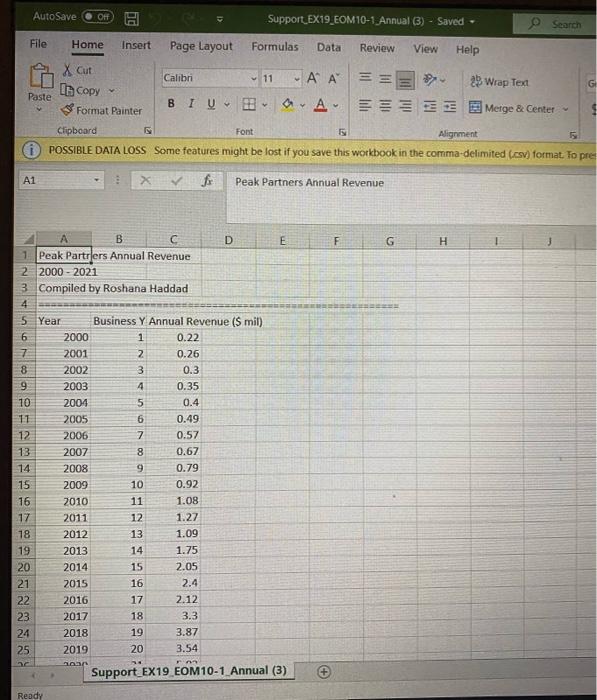
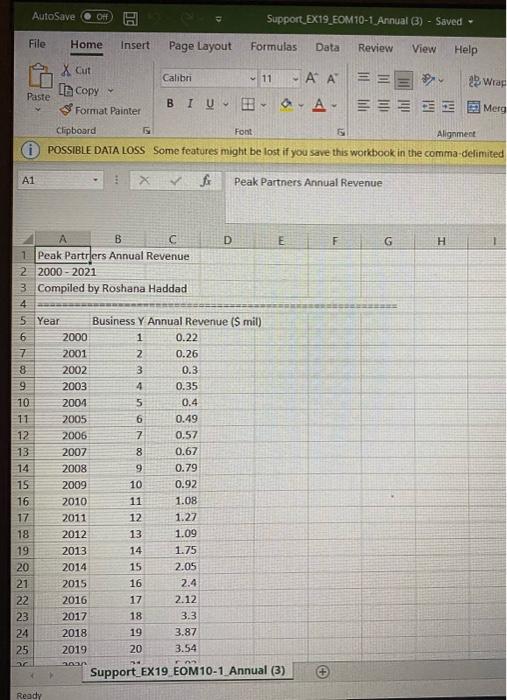
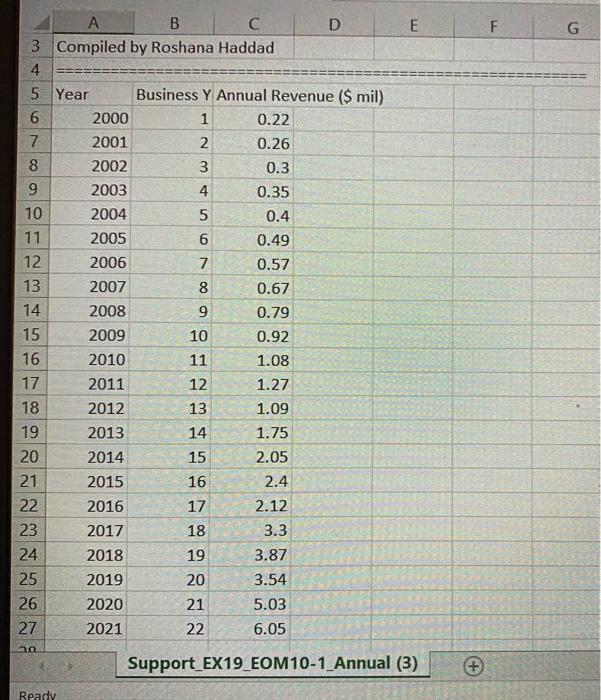
PROJECT STEPS 1. Roshana Haddad is a financial analyst for Peak Partners, a full-service recruiting agency with headquarters in New York City and offices in five other U.S. cities. Roshana asks for your help in producing a revenue report. She wants to analyze revenue for the past year and project future sales for all the offices. To create the report, you need to Import data from various sources and use the Excel Power tools. Go to the Revenue History worksheet, where Roshana wants to view how sales have changed since the business was founded in the year 2000. She has a text file that already contains this data. Create a new query that imports data from the Support_EX19_EOM10-1_Annual.csv text file. Edit the query to remove the first four rows of data and to use the titles in the fifth row as column headers. Close and load the query data to a table in cell B3 of the existing worksheet. Apply the Dark Green, Table Style Medium 3 table style to the new table to coordinate with the Peak Partners logo. 2. Roshana asks you to create a chart that compares the revenue for each business year. Create a scatter chart of the Business Year and Annual Revenue data (range C3:D25). Oude No.1, C1. Contenant 2 - We Home art Page Layout Forms Data w View Help ro Dedo ni bang Shane 02 C 11 YY 1. Son 7 F YA Toto Wht for CA Day >$ A 0 G H M N 0 P 9 Revenue 2000 - 2021 CHERS 11 14 AutoSave OF NP_EX19.EOM10-1_DanielaFernandez 2- Search File Home Insert Review View Help From Text/CSV From Web From Table/Range Page Layout Formulas Data De Recent Sources Existing Connections Refresh Queries & Connections Properties Edit Links Stocks Get Currencies Sort Filter poly Advanced Sort & Fiter Data All Get a transform Data Queries Connections Data Types B3 B D E F G H H K 1 Revenue 2000 - 2021 PEAK PARTNERS NMON 2 3 4 5 6 7 8 9 10 11 12 13 14 15 16 17 18 19 20 21 22 23 24 Documentation Revenue History Monthly Sales Positions Pivot Revenue by State AutoSave OFF A Support EX19_EOM10-1 Annual (3) - Saved Search File Home Insert Page Layout Formulas Data Review View Help X Cut In Copy * Format Painter Calibri - 11-AA== 25 Wrap Test 8 I UB O A Merge & Center Paste Clipboard Font Alignment 5 POSSIBLE DATA LOSS Some features might be lost if you save this workbook in the comma-delimited (cs) format. To pre A1 XV Peak Partners Annual Revenue F G H A B D E 1 Peak Partrjers Annual Revenue 2 2000 - 2021 3 Compiled by Roshana Haddad 4 5 Year Business Y Annual Revenue (Smil) 6 2000 1 0.22 7 2001 2 0.26 8 2002 3 0.3 9 2003 4 0.35 10 2004 5 0.4 11 2005 6 0.49 12 2006 7 0.57 13 2007 8 0.67 14 2008 9 0.79 15 2009 10 0.92 16 2010 11 1.08 17 2011 12 1.27 18 2012 13 1.09 19 2013 14 1.75 20 2014 15 2.05 21 2015 16 2.4 22 2016 17 2.12 23 2017 18 3.3 24 2018 19 3.87 25 2019 20 3.54 ana Support EX19 EOM10-1 Annual (3) Ready AutoSave OH Support_EX19_EOM10-1 Annual (3) - Saved - File Home Insert Page Layout Formulas Data Review View Help X Cut Calibri 11 AA = = = ? 23 Wrap In Copy Paste BIU a-A- Merg Format Painter Clipboard Font 5 Alignment POSSIBLE DATA LOSS Some features might be lost if you save this workbook in the comma-delimited 41 f Peak Partners Annual Revenue F G H A B D E 1. Peak Partrlers Annual Revenue 2 2000 - 2021 3 Compiled by Roshana Haddad 4 5 Year Business Y Annual Revenue (S mil) 6 2000 1 0.22 7 2001 2 0.26 8 2002 3 0.3 9 2003 4 0.35 10 2004 5 0.4 11 2005 6 0.49 12 2006 7 0.57 13 2007 8 0.67 14 2008 9 0.79 15 2009 10 0.92 16 2010 11 1.08 17 2011 12 1.27 18 2012 13 1.09 19 2013 14 1.75 20 2014 15 2.05 21 2015 16 2.4 2016 17 2.12 23 2017 18 3.3 24 2018 19 3.87 25 2019 20 3.54 an Support EX 19 EOM10-1 Annual (3) 22 Ready E F G II II II A B C D 3 Compiled by Roshana Haddad 4 ========== ======== 5 Year Business Y Annual Revenue ($ mil) 6 2000 1 0.22 7 2001 2 0.26 8 2002 3 0.3 9 2003 4 0.35 10 2004 5 0.4 11 2005 6 0.49 12 2006 7 0.57 13 2007 8 0.67 14 2008 9 0.79 15 2009 10 0.92 16 2010 11 1.08 17 2011 12 1.27 18 2012 13 1.09 19 2013 14 1.75 2014 15 2.05 21 2015 16 2.4 22 2016 17 2.12 23 2017 18 3.3 24 2018 19 3.87 25 2019 20 3.54 26 2020 21 5.03 27 2021 22 6.05 20 20 Support EX19_EOM10-1_Annual (3) + Ready PROJECT STEPS 1. Roshana Haddad is a financial analyst for Peak Partners, a full-service recruiting agency with headquarters in New York City and offices in five other U.S. cities. Roshana asks for your help in producing a revenue report. She wants to analyze revenue for the past year and project future sales for all the offices. To create the report, you need to Import data from various sources and use the Excel Power tools. Go to the Revenue History worksheet, where Roshana wants to view how sales have changed since the business was founded in the year 2000. She has a text file that already contains this data. Create a new query that imports data from the Support_EX19_EOM10-1_Annual.csv text file. Edit the query to remove the first four rows of data and to use the titles in the fifth row as column headers. Close and load the query data to a table in cell B3 of the existing worksheet. Apply the Dark Green, Table Style Medium 3 table style to the new table to coordinate with the Peak Partners logo. 2. Roshana asks you to create a chart that compares the revenue for each business year. Create a scatter chart of the Business Year and Annual Revenue data (range C3:D25). Oude No.1, C1. Contenant 2 - We Home art Page Layout Forms Data w View Help ro Dedo ni bang Shane 02 C 11 YY 1. Son 7 F YA Toto Wht for CA Day >$ A 0 G H M N 0 P 9 Revenue 2000 - 2021 CHERS 11 14 AutoSave OF NP_EX19.EOM10-1_DanielaFernandez 2- Search File Home Insert Review View Help From Text/CSV From Web From Table/Range Page Layout Formulas Data De Recent Sources Existing Connections Refresh Queries & Connections Properties Edit Links Stocks Get Currencies Sort Filter poly Advanced Sort & Fiter Data All Get a transform Data Queries Connections Data Types B3 B D E F G H H K 1 Revenue 2000 - 2021 PEAK PARTNERS NMON 2 3 4 5 6 7 8 9 10 11 12 13 14 15 16 17 18 19 20 21 22 23 24 Documentation Revenue History Monthly Sales Positions Pivot Revenue by State AutoSave OFF A Support EX19_EOM10-1 Annual (3) - Saved Search File Home Insert Page Layout Formulas Data Review View Help X Cut In Copy * Format Painter Calibri - 11-AA== 25 Wrap Test 8 I UB O A Merge & Center Paste Clipboard Font Alignment 5 POSSIBLE DATA LOSS Some features might be lost if you save this workbook in the comma-delimited (cs) format. To pre A1 XV Peak Partners Annual Revenue F G H A B D E 1 Peak Partrjers Annual Revenue 2 2000 - 2021 3 Compiled by Roshana Haddad 4 5 Year Business Y Annual Revenue (Smil) 6 2000 1 0.22 7 2001 2 0.26 8 2002 3 0.3 9 2003 4 0.35 10 2004 5 0.4 11 2005 6 0.49 12 2006 7 0.57 13 2007 8 0.67 14 2008 9 0.79 15 2009 10 0.92 16 2010 11 1.08 17 2011 12 1.27 18 2012 13 1.09 19 2013 14 1.75 20 2014 15 2.05 21 2015 16 2.4 22 2016 17 2.12 23 2017 18 3.3 24 2018 19 3.87 25 2019 20 3.54 ana Support EX19 EOM10-1 Annual (3) Ready AutoSave OH Support_EX19_EOM10-1 Annual (3) - Saved - File Home Insert Page Layout Formulas Data Review View Help X Cut Calibri 11 AA = = = ? 23 Wrap In Copy Paste BIU a-A- Merg Format Painter Clipboard Font 5 Alignment POSSIBLE DATA LOSS Some features might be lost if you save this workbook in the comma-delimited 41 f Peak Partners Annual Revenue F G H A B D E 1. Peak Partrlers Annual Revenue 2 2000 - 2021 3 Compiled by Roshana Haddad 4 5 Year Business Y Annual Revenue (S mil) 6 2000 1 0.22 7 2001 2 0.26 8 2002 3 0.3 9 2003 4 0.35 10 2004 5 0.4 11 2005 6 0.49 12 2006 7 0.57 13 2007 8 0.67 14 2008 9 0.79 15 2009 10 0.92 16 2010 11 1.08 17 2011 12 1.27 18 2012 13 1.09 19 2013 14 1.75 20 2014 15 2.05 21 2015 16 2.4 2016 17 2.12 23 2017 18 3.3 24 2018 19 3.87 25 2019 20 3.54 an Support EX 19 EOM10-1 Annual (3) 22 Ready E F G II II II A B C D 3 Compiled by Roshana Haddad 4 ========== ======== 5 Year Business Y Annual Revenue ($ mil) 6 2000 1 0.22 7 2001 2 0.26 8 2002 3 0.3 9 2003 4 0.35 10 2004 5 0.4 11 2005 6 0.49 12 2006 7 0.57 13 2007 8 0.67 14 2008 9 0.79 15 2009 10 0.92 16 2010 11 1.08 17 2011 12 1.27 18 2012 13 1.09 19 2013 14 1.75 2014 15 2.05 21 2015 16 2.4 22 2016 17 2.12 23 2017 18 3.3 24 2018 19 3.87 25 2019 20 3.54 26 2020 21 5.03 27 2021 22 6.05 20 20 Support EX19_EOM10-1_Annual (3) + Ready
Step by Step Solution
There are 3 Steps involved in it
Sure lets go through the steps you need to complete this project Step 1 Import Data from CSV File 1 ... View full answer

Get step-by-step solutions from verified subject matter experts