

Question: Please help me. Task. Almost all formula available below. Please help me and just find and put the values only from given statements (Ex. Earnings
Please help me.
![9957209 Capital Employed (D) [B-C] 36251875 33047897 30414169 28025832 Current Asset (E)](https://dsd5zvtm8ll6.cloudfront.net/si.experts.images/questions/2024/10/6713e75dbb181_6616713e75d5772b.jpg)
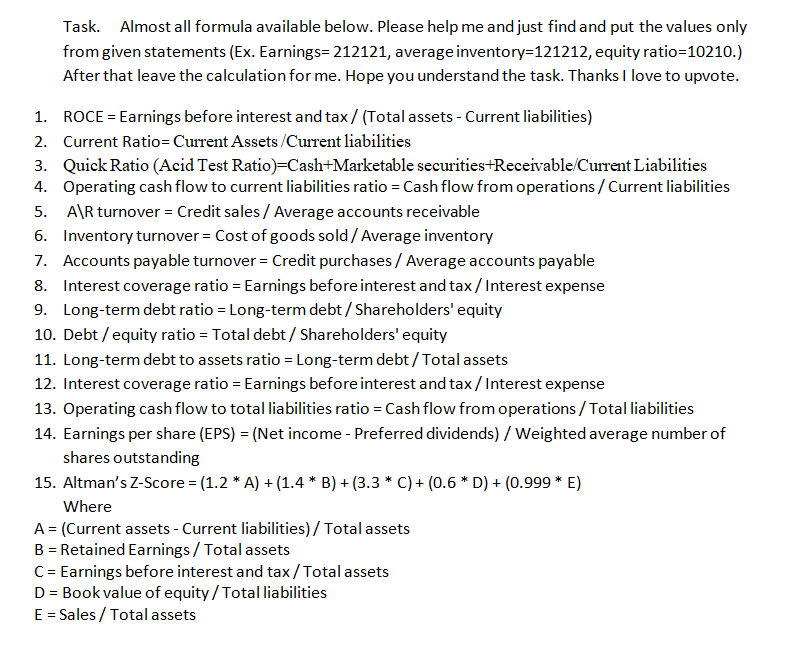
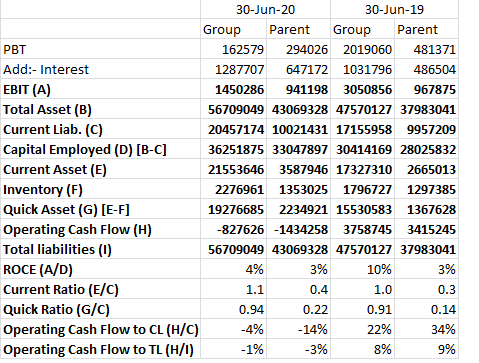
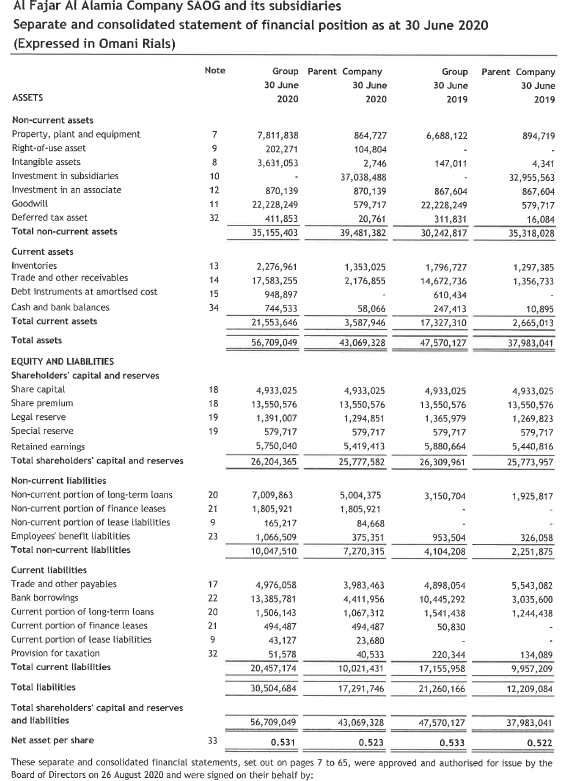
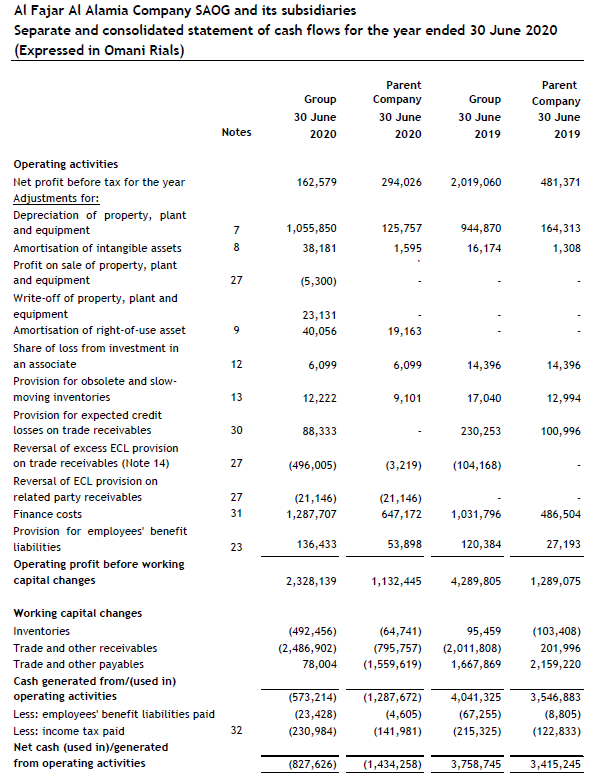
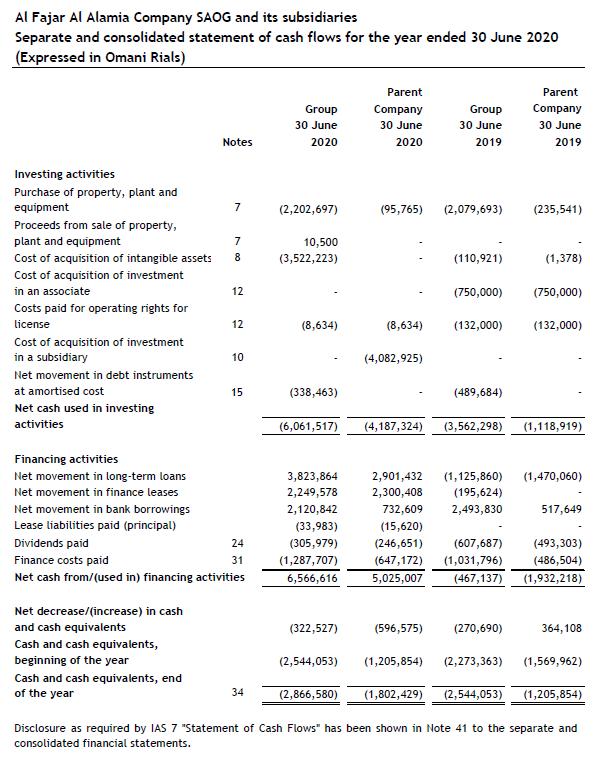
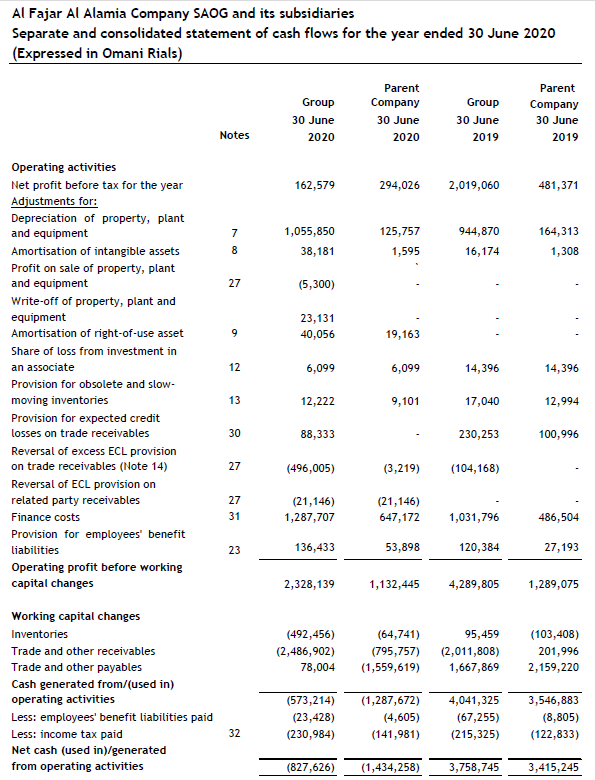
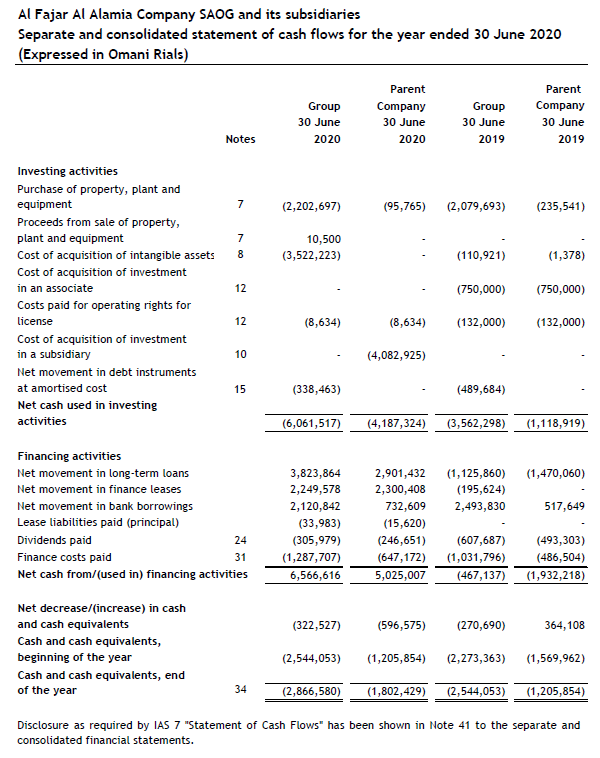
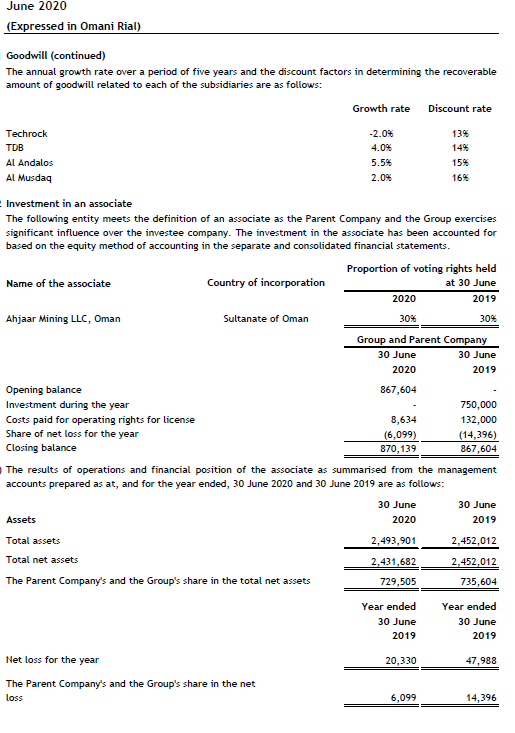
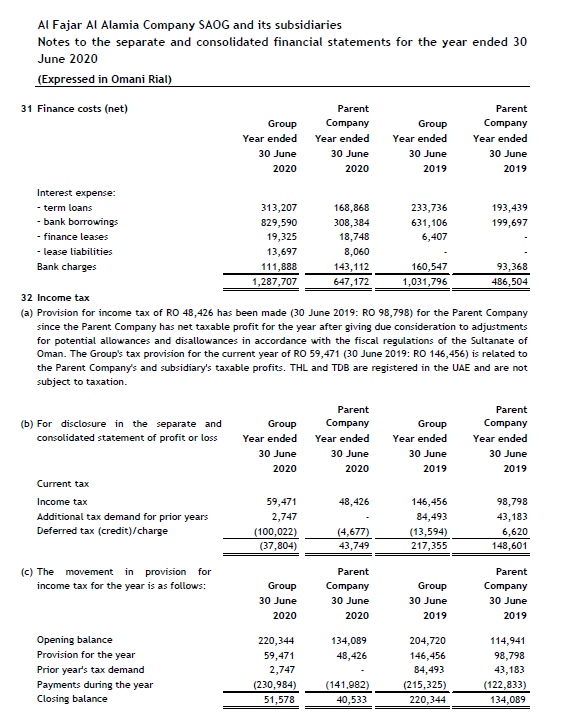
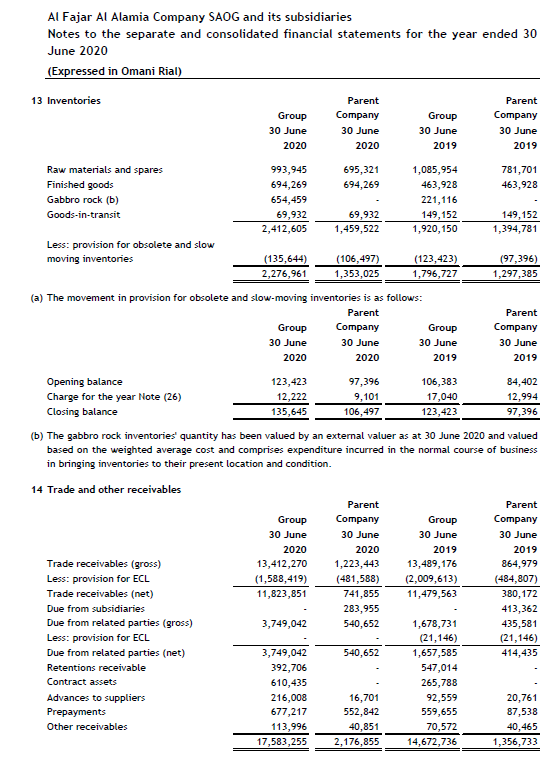
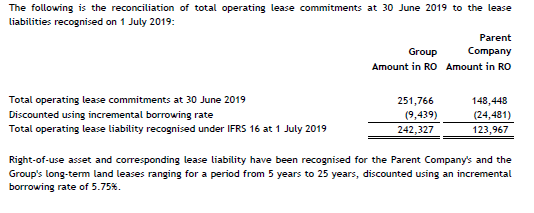
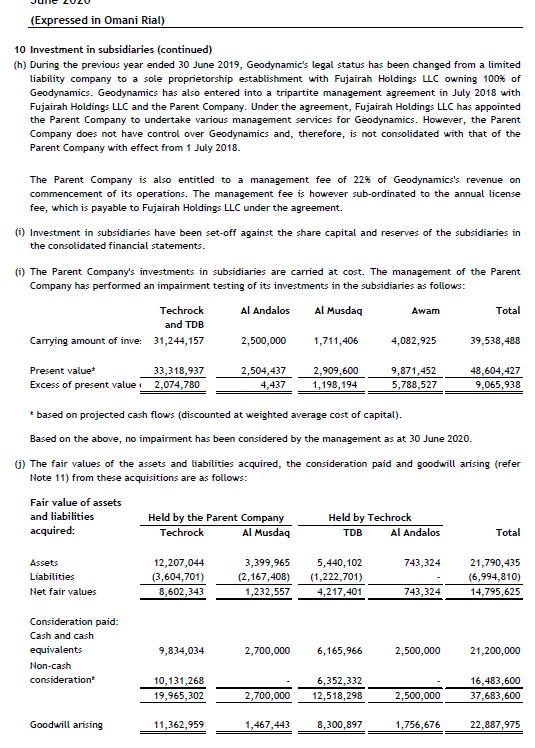
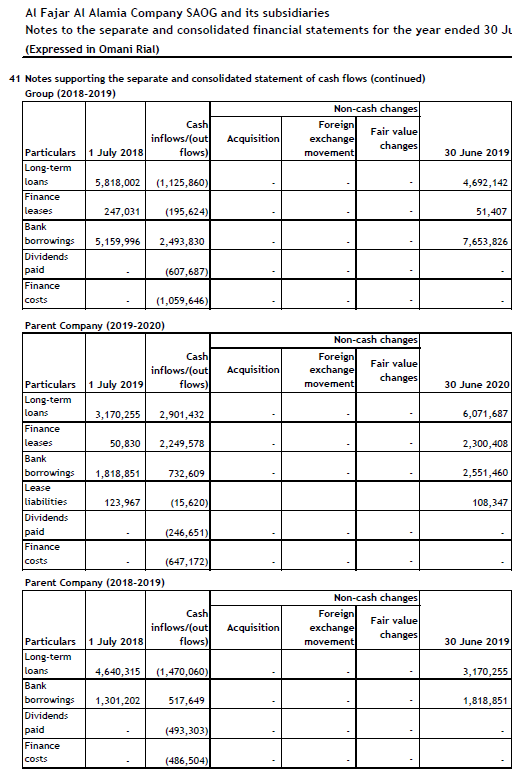
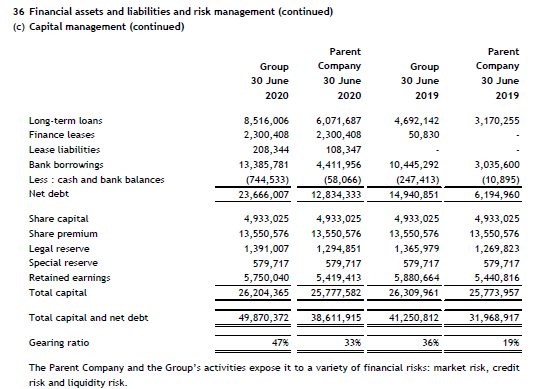
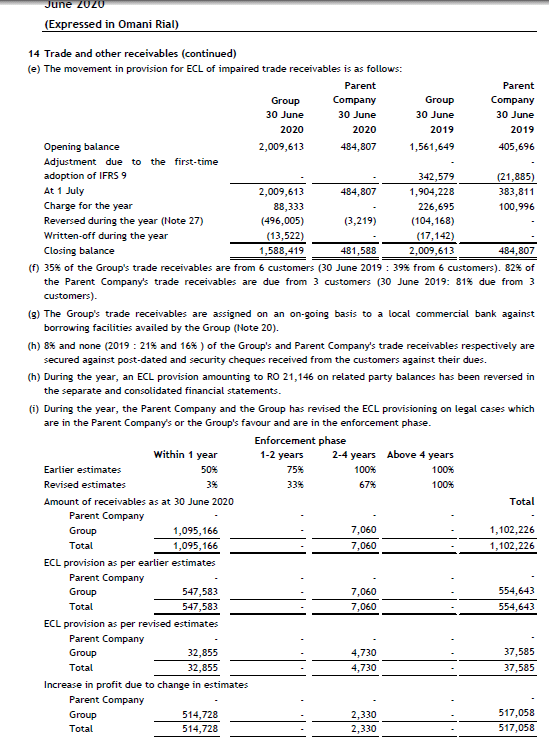
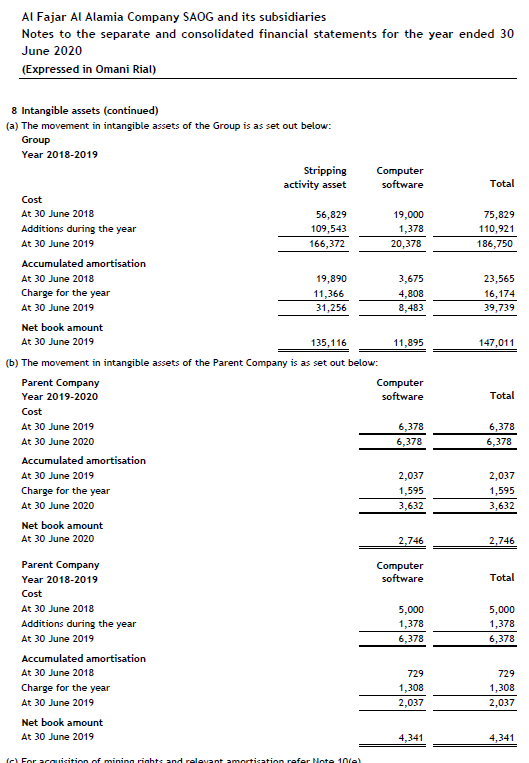
Task. Almost all formula available below. Please help me and just find and put the values only from given statements (Ex. Earnings 212121, average inventory=121212, equity ratio=10210.) After that leave the calculation for me. Hope you understand the task. Thanks I love to upvote. 1. ROCE = Earnings before interest and tax/ (Total assets - Current liabilities) 2. Current Ratio=Current Assets/Current liabilities 3. Quick Ratio (Acid Test Ratio)=Cash+Marketable securities Receivable/Current Liabilities 4. Operating cash flow to current liabilities ratio = Cash flow from operations / Current liabilities 5. A\R turnover = Credit sales / Average accounts receivable 6. Inventory turnover = Cost of goods sold / Average inventory 7. Accounts payable turnover = Credit purchases / Average accounts payable 8. Interest coverage ratio = Earnings before interest and tax/Interest expense 9. Long-term debt ratio = Long-term debt/Shareholders' equity 10. Debt / equity ratio = Total debt / Shareholders' equity 11. Long-term debt to assets ratio = Long-term debt/Total assets 12. Interest coverage ratio = Earnings before interest and tax/Interest expense 13. Operating cash flow to total liabilities ratio = Cash flow from operations / Total liabilities 14. Earnings per share (EPS) = (Net income - Preferred dividends) / Weighted average number of shares outstanding 15. Altman's Z-Score = (1.2 * A) + (1.4* B)+(3.3 * C) + (0.6*D) + (0.999* E) Where A = (Current assets - Current liabilities)/ Total assets B = Retained Earnings / Total assets C = Earnings before interest and tax/Total assets D = Book value of equity/Total liabilities E = Sales/ Total assets 30-Jun-20 - 30-Jun-19 - Group Parent Group Parent PBT 162579 294026 2019060 481371 Add:- Interest 1287707 647172 1031796 486504 EBIT (A) 1450286 941198 3050856 967875 Total Asset (B) 56709049 43069328 47570127 37983041 Current Liab. (C) 20457174 10021431 17155958 9957209 Capital Employed (D) [B-C] 36251875 33047897 30414169 28025832 Current Asset (E) 21553646 3587946 17327310 2665013 Inventory (F) 2276961 1353025 1796727 1297385 Quick Asset (G) [E-F] 19276685 2234921 15530583 1367628 Operating Cash Flow (H) -827626 -1434258 3758745 3415245 Total liabilities (1) 56709049 43069328 47570127 37983041 ROCE (A/D) 4% 3% 10% 3% Current Ratio (E/C) 1.1 0.4 1.0 0.3 Quick Ratio (G/C) 0.94 0.22 0.91 0.14 Operating Cash Flow to CL (H/C) -4% -14% 22% 34% Operating Cash Flow to TL (H/1) - 1% -3% 8% 9% Al Fajar Al Alamia Company SAOG and its subsidiaries Separate and consolidated statement of financial position as at 30 June 2020 (Expressed in Omani Rials) Note Group Parent Company 30 June 30 June 2020 2020 Group 30 June 2019 Parent Company 30 June 2019 ASSETS Non-current assets Property, plant and equipment 7 7,811,838 864,727 6,688,122 894,719 Right-of-use asset 9 202,271 104,804 Intangible assets 8 3,631,053 2,746 147,011 4,341 Investment in subsidiaries 10 37,038,488 32,955,563 Investment in an associate 12 870,139 870,139 867,604 867,604 Goodwill 11 22,228,249 579,717 22,228,249 579,717 Deferred tax asset 32 411,853 20,761 311,831 16,084 Total non-current assets 35,155,403 39,481,382 30,242,817 35,318,028 Current assets Inventories 13 2,276,961 1,353,025 1,796,727 1,297,385 Trade and other receivables 14 17,583,255 2,176,855 14,672,736 1,356,733 Debt instruments at amortised cost 15 948,897 610,434 Cash and bank balances 34 744,533 58,066 247,413 10,895 Total current assets 21,553,646 3,587,946 17,327,310 2,665,013 Total assets 56,709,049 43,069,328 47,570,127 37,983,041 EQUITY AND LIABILITIES Shareholders' capital and reserves Share capital 18 4,933,025 4,933,025 4,933,025 4,933,025 Share premium 18 13,550,576 13,550,576 13,550,576 13,550,576 Legal reserve 19 1,391,007 1,294,851 1,365,979 1,269,823 Special reserve 19 579,717 579,717 579,717 579,717 Retained earnings 5,750,040 5,419,413 5,880,664 5,440,816 Total shareholders' capital and reserves 26,204,365 25,777,582 26,309,961 25,773,957 Non-current liabilities Non-current portion of long-term loans 20 7,009,863 5,004,375 3,150,704 1,925,817 Non-current portion of finance leases 21 1,805,921 1,805,921 Non-current portion of lease liabilities 165,217 84,668 Employees' benefit liabilities 23 1,066,509 375,351 953,504 326,058 Total non-current liabilities 10,047,510 7,270,315 4,104,208 2,251,875 Current liabilities Trade and other payables 17 4,976,058 3,983,463 4,898,054 5,543,082 Bank borrowings 22 13,385,781 4,411,956 10,445,292 3,035,600 Current portion of long-term loans 20 1,506,143 1,067,312 1,541,438 1,244,438 Current portion of finance leases 21 494,487 494,487 50,830 Current portion of lease liabilities 43,127 23,680 Provision for taxation 32 51,578 40,533 220,344 134,089 Total current liabilities 20,457,174 10,021,431 17,155,958 9,957,209 Total liabilities 30,504,684 17,291,746 21,260,166 12,209,084 Total shareholders' capital and reserves and liabilities 56,709,049 43,069,328 47,570,127 37,983,041 Net asset per share 33 0.531 0.523 0.533 0.522 These separate and consolidated financial statements, set out on pages 7 to 65, were approved and authorised for issue by the Board of Directors on 26 August 2020 and were signed on their behalf by: Al Fajar Al Alamia Company SAOG and its subsidiaries Separate and consolidated statement of cash flows for the year ended 30 June 2020 (Expressed in Omani Rials) Group 30 June 2020 Parent Company 30 June 2020 Group 30 June 2019 Parent Company 30 June 2019 Notes 162,579 294,026 2,019,060 481,371 7 1,055,850 38,181 125,757 1,595 944,870 16,174 164,313 1,308 8 27 (5,300) 23,131 40,056 9 19,163 12 6,099 6,099 14,396 14,396 Operating activities Net profit before tax for the year Adjustments for: Depreciation of property, plant and equipment Amortisation of intangible assets Profit on sale of property, plant and equipment Write-off of property, plant and equipment Amortisation of right-of-use asset Share of loss from investment in an associate Provision for obsolete and slow- moving inventories Provision for expected credit losses on trade receivables Reversal of excess ECL provision on trade receivables (Note 14) Reversal of ECL provision on related party receivables Finance costs Provision for employees' benefit liabilities Operating profit before working capital changes 12,222 9,101 17,040 12,994 30 88,333 230,253 100,996 27 (496,005) (3,219) (104,168) 27 31 (21,146) 1,287,707 (21,146) 647,172 1,031,796 486,504 23 136,433 53,898 120,384 27,193 2,328,139 1,132,445 4,289,805 1,289,075 (492,456) (2,486,902) 78,004 (64,741) (795,757) (1,559,619) 95,459 (2,011,808) 1,667,869 (103,408) 201,996 2,159,220 Working capital changes Inventories Trade and other receivables Trade and other payables Cash generated from/(used in) operating activities Less: employees' benefit liabilities paid Less: income tax paid Net cash (used in)/generated from operating activities (573,214) (23,428) (230,984) (1,287,672) (4,605) (141,981) 4,041,325 (67,255) (215,325) 3,546,883 (8,805) (122,833) 32 (827,626) (1,434,258) 3,758,745 3,415,245 Al Fajar Al Alamia Company SAOG and its subsidiaries Separate and consolidated statement of cash flows for the year ended 30 June 2020 (Expressed in Omani Rials) Group 30 June 2020 Parent Company 30 June 2020 Group 30 June 2019 Parent Company 30 June 2019 Notes 7 (2,202,697) (95,765) (2,079,693) (235,541) 7 10,500 (3,522,223) 8 (110,921) (1,378) 12 (750,000) Investing activities Purchase of property, plant and equipment Proceeds from sale of property, plant and equipment Cost of acquisition of intangible assets Cost of acquisition of investment in an associate Costs paid for operating rights for license Cost of acquisition of investment in a subsidiary Net movement in debt instruments at amortised cost Net cash used in investing activities (750,000) 12 (8,634) (8,634) (132,000) (132,000) 10 (4,082,925) 15 (338,463) (489,684) (6,061,517) (4,187,324) (3,562,298) (1,118,919) (1,470,060) (1,125,860) (195,624) 2,493,830 517,649 Financing activities Net movement in long-term loans Net movement in finance leases Net movement in bank borrowings Lease liabilities paid (principal) Dividends paid 24 Finance costs paid 31 Net cash from/(used in) financing activities 3,823,864 2,249,578 2,120,842 (33,983) (305,979) (1,287,707) 6,566,616 2,901,432 2,300,408 732,609 (15,620) (246,651) (647,172) 5,025,007 (607,687) (1,031,796) (467,137) (493,303) (486,504) (1,932,218) (322,527) (596,575) (270,690) 364,108 Net decrease/(increase) in cash and cash equivalents Cash and cash equivalents, beginning of the year Cash and cash equivalents, end of the year (2,544,053) (1,205,854) (2,273,363) (1,569,962) 34 (2,866,580) (1,802,429) (2,544,053) (1,205,854) Disclosure as required by IAS 7 "Statement of Cash Flows" has been shown in Note 41 to the separate and consolidated financial statements. Al Fajar Al Alamia Company SAOG and its subsidiaries Separate and consolidated statement of cash flows for the year ended 30 June 2020 (Expressed in Omani Rials) Group 30 June 2020 Parent Company 30 June 2020 Group 30 June Parent Company 30 June 2019 Notes 2019 162,579 294,026 2,019,060 481,371 7 1,055,850 38,181 8 1,595 16,174 1,308 27 (5,300) 9 23,131 40,056 19,163 12 6,099 6,099 14,396 14,396 Operating activities Net profit before tax for the year Adjustments for: Depreciation of property, plant and equipment Amortisation of intangible assets Profit on sale of property, plant and equipment Write-off of property, plant and equipment Amortisation of right-of-use asset Share of loss from investment in an associate Provision for obsolete and slow- moving inventories Provision for expected credit losses on trade receivables Reversal of excess ECL provision on trade receivables (Note 14) Reversal of ECL provision on related party receivables Finance costs Provision for employees' benefit liabilities Operating profit before working capital changes 13 12,222 9,101 17,040 12,994 30 88,333 230,253 100,996 27 (496,005) (3,219) (104,168) 27 31 (21,146) 1,287,707 (21,146) 647,172 1,031,796 486,504 23 136,433 53,898 120,384 27,193 2,328,139 1,132,445 4,289,805 1,289,075 (492,456) (2,486,902) 78,004 (64,741) (795,757) (1,559,619) 95,459 (2,011,808) 1,667,869 (103,408) 201,996 2,159,220 Working capital changes Inventories Trade and other receivables Trade and other payables Cash generated from/(used in) operating activities Less: employees' benefit liabilities paid Less: income tax paid Net cash (used in)/generated from operating activities (573,214) (23,428) (230,984) (1,287,672) (4,605) (141,981) 4,041,325 (67,255) (215,325) 3,546,883 (8,805) (122,833) 32 (827,626) (1,434,258) 3,758,745 3,415,245 Al Fajar Al Alamia Company SAOG and its subsidiaries Separate and consolidated statement of cash flows for the year ended 30 June 2020 (Expressed in Omani Rials) Group 30 June 2020 Parent Company 30 June 2020 Group 30 June 2019 Parent Company 30 June 2019 Notes 7 (2,202,697) (95,765) (2,079,693) (235,541) 7 8 10,500 (3,522,223) (110,921) (1,378) 12 (750,000) (750,000) Investing activities Purchase of property, plant and equipment Proceeds from sale of property, plant and equipment Cost of acquisition of intangible assets Cost of acquisition of investment in an associate Costs paid for operating rights for license Cost of acquisition of investment in a subsidiary Net movement in debt instruments at amortised cost Net cash used in investing activities 12 (8,634) (8,634) (132,000) (132,000) 10 (4,082,925) 15 (338,463) (489,684) (6,061,517) (4,187,324) (3,562,298) (1,118,919) (1,470,060) (1,125,860) (195,624) 2,493,830 517,649 Financing activities Net movement in long-term loans Net movement in finance leases Net movement in bank borrowings Lease liabilities paid (principal) Dividends paid 24 Finance costs paid 31 Net cash from/(used in) financing activities 3,823,864 2,249,578 2,120,842 (33,983) (305,979) (1,287,707) 6,566,616 2,901,432 2,300,408 732,609 (15,620) (246,651) (647,172) 5,025,007 (607,687) (1,031,796) (467,137) (493,303) (486,504) (1,932,218) (322,527) (596,575) (270,690) 364,108 Net decrease/(increase) in cash and cash equivalents Cash and cash equivalents, beginning of the year Cash and cash equivalents, end of the year (2,544,053) (1,205,854) (2,273,363) (1,569,962) 34 (2,866,580) (1,802,429) (2,544,053) (1,205,854) Disclosure as required by IAS 7 "Statement of Cash Flows" has been shown in Note 41 to the separate and consolidated financial statements. June 2020 (Expressed in Omani Rial) Goodwill continued) The annual growth rate over a period of five years and the discount factors in determining the recoverable amount of goodwill related to each of the subsidiaries are as follows: Growth rate Discount rate Techrock TDB Al Andalos Al Musdaq -2.0% 4.0% 5.5% 2.0% 134 14% 15% 16% - Investment in an associate The following entity meets the definition of an associate as the Parent Company and the Group exercises significant influence over the investee company. The investment in the associate has been accounted for based on the equity method of accounting in the separate and consolidated financial statements. Proportion of voting rights held Name of the associate Country of incorporation at 30 June 2020 2019 Ahjaar Mining LLC, Oman Sultanate of Oman 30% 30% Group and Parent Company 30 June 30 June 2020 2019 Opening balance 867,604 Investment during the year 750,000 Costs paid for operating rights for license 8,634 132,000 Share of net loss for the year (6,099) (14,396) Closing balance 870,139 867,604 The results of operations and financial position of the associate as summarised from the management accounts prepared as at, and for the year ended, 30 June 2020 and 30 June 2019 are as follows: 30 June 30 June Assets 2020 2019 Total assets 2,493,901 2,452,012 Total net assets 2,431,682 2,452,012 The Parent company's and the Group's share in the total net assets 729,505 735,604 Year ended 30 June 2019 Year ended 30 June 2019 Net loss for the year 20,330 47,988 The Parent Company's and the Group's share in the net loss 6,099 14,396 33 Net assets per share and basic earnings per share Net assets per share Net assets per share is calculated by dividing the net assets by the number of shares outstanding at the separate and consolidated statement of financial position date as follows: Parent Parent Group Company Group Company 30 June 30 June 30 June 30 June 2020 2020 2019 2019 Net assets 26,204,365 25,777,582 26,309,961 25,773,957 Number of shares outstanding 49,330,250 49,330,250 49,330,250 49,330,250 Net assets per share 0.531 0.523 0.533 0.522 Basic earnings per share Basic earnings per share is calculated by dividing the net profit for the year attributable to the shareholders of the Parent company by the weighted average number of shares outstanding during the year as follows: Parent Parent Group Company Group Company 30 June 30 June 30 June 30 June 2020 2020 2019 2019 Net profit after tax for the year 200,383 250,277 1,801,705 332,770 Weighted average number of shares 49,330,250 49,330,250 49,330,250 49,330,250 Basic and diluted earnings per share 0.004 0.005 0.037 0.007 As the Parent Company does not have any dilutive shares, the basic and diluted earnings per share are the same. 34 Cash and cash equivalents For the purposes of the separate and consolidated statement of cash flows, cash and cash equivalents comprise the following: Parent Parent Group Company Group Company 30 June 30 June 30 June 30 June 2020 2020 2019 2019 6,707 Cash on hand Margin money Current account balances with banks Less: provision for ECL (b) 8,445 49,621 4,188 46,305 96,920 604,865 (3,558) 744,533 (3,611,112) (2,866,580) 47,697 46,656 156,618 (3,558) 247,413 (2,791,466) (2,544,053) Less: bank overdrafts (Note 22) 58,066 (1,860,495) (1,802,429) 10,895 (1,216,749) (1,205,854) 9,101 Al Fajar Al Alamia Company SAOG and its subsidiaries Notes to the separate and consolidated financial statements for the year ended 30 June 2020 (Expressed in Omani Rial) 26 Cost of revenue Parent Parent Group Company Group Company Year ended Year ended Year ended Year ended 30 June 30 June 30 June 30 June 2020 2020 2019 2019 Materials and other direct costs 9,582,740 3,138,971 11,667,755 3,213,278 Direct wages and salaries 2,830,624 419,212 3,049,358 390,370 Depreciation (Note 7) 1,002,455 113,721 909,011 152,502 Amortisation of intangible assets (Note 8) 33,274 11,366 Provision for obsolete and slow- moving inventories (Note 13) 12,222 17,040 12,994 13,461,315 3,681,006 15,654,530 3,769,144 27 Other income Parent Parent Group Company Group Company Year ended Year ended Year ended Year ended 30 June 30 June 30 June 30 June 2020 2020 2019 2019 Survey income 44,151 60,540 Transportation income 45,859 45,859 62,517 62,517 Rental and equipment hire income 70,016 13,785 42,346 18,596 Profit on sale of property, plant and equipment 5,300 Compensation and claims receivable 115,244 126,331 Reversal of ECL provision on related party receivables (Note 14) 21,146 21,146 Miscellaneous income 23,009 10,606 289 324,725 80,790 302,340 81,402 28 Employees' salaries and other related costs Parent Parent Group Company Group Company Year ended Year ended Year ended Year ended 30 June 30 June 30 June 30 June 2020 2020 2019 2019 Salaries, wages and allowances 796,846 635,801 830,857 641,864 Cost of employees' benefit liabilities for expatriate employees 25,182 25,182 27,193 27,193 Social security for Omani employees 25, 117 25, 117 23,914 23,914 847,145 686, 100 881,964 692,971 Less: included under direct costs (419,212) (419,212) (390,370) (390,370) 427,933 266,888 491,594 302,601 Al Fajar Al Alamia Company SAOG and its subsidiaries Notes to the separate and consolidated financial statements for the year ended 30 June 2020 (Expressed in Omani Rial) 36 Financial assets and liabilities and risk management (continued) (f) Liquidity risk (continued) The contractual maturity profile of financial liabilities is as follows: Less than 1 year More than 1 year Group Total At 30 June 2020 Trade and other payables Bank borrowings Long-term loans Lease liabilities Finance leases 4,976,058 13,385,781 1,506,143 43, 127 494, 487 20,405,596 7,009,863 165,217 1,805,921 8,981,002 4,976,058 13,385,781 8,516,006 208,344 2,300,408 29,386,598 At 30 June 2019 Trade and other payables Bank borrowings Long-term loans Finance leases 4,898,054 10,445,292 1,541,438 50,830 16,935,614 3,150,704 4,898,054 10,445,292 4,692, 142 50,830 20,086,318 3,150,704 Less than 1 year More than 1 year Parent Company Total At 30 June 2020 Trade and other payables Bank borrowings Long-term loans Finance leases Lease liabilities 3,983,463 4,411,956 1,067,312 494,487 23,680 9,980,897 5,004,375 1,805,921 84,668 6,894,965 3,983,463 4,411,956 6,071,687 2,300,408 108,347 16,875,861 At 30 June 2019 Trade and other payables Bank borrowings Long-term loans 5,543,082 3,035,600 1,244,438 9,823, 120 1,925,817 1,925,817 5,543,082 3,035,600 3,170,255 11,748,937 32 Income tax (continued) (e) Deferred tax asset Deferred income taxes are calculated on all temporary differences under the liability method using a principal tax-rate in accordance with the tax laws of the Sultanate of Oman. The net deferred tax asset and deferred tax release in the separate and consolidated statement of profit or loss is as follows: 30 June 2020 30 June 2019 Group Opening balance Created during the year Closing balance 311,831 100,022 411,853 298,237 13,594 311,831 30 June 2020 30 June 2019 Parent Company Opening balance Created/(reversed) during the year Closing balance 16,084 4,677 20,761 22,704 (6,620) 16,084 (f) The reconciliation of taxation on the accounting profit with the taxation charge for the year is as follows: Group 30 June 2020 Parent Company 30 June 2020 Group 30 June 2019 Parent Company 30 June 2019 Tax charge on accounting profit 55,780 44,104 160,642 79,232 Add: Additional tax demand for prior years 2,747 84,493 43,183 Net effect of depreciation, exempt income and expenses disallowed (96,331) (355) (27,780) 26,186 Taxation(reversal)/charge (37,804) 43,749 217,355 148,601 (3) Tax assessment status Income tax assessments have been completed for the Parent Company up to the tax year ended 30 June 2016. The status of income tax assessments for other entities within the Group pending to be finalised by the Tax Authority is as follows: Assessment completed upto year Al Fajar Al Alamia Company SAOG and its subsidiaries Notes to the separate and consolidated financial statements for the year ended 30 June 2020 (Expressed in Omani Rial) 31 Finance costs (net) Group Year ended 30 June 2020 Parent Company Year ended 30 June 2020 Group Year ended 30 June 2019 Parent Company Year ended 30 June 2019 Interest expense: - term loans 313,207 168,868 233,736 193,439 - bank borrowings 829,590 308,384 631,106 199,697 - finance leases 19,325 18,748 6,407 - lease liabilities 13,697 8,060 Bank charges 111,888 143, 112 160,547 93,368 1,287,707 647,172 1,031,796 486,504 32 Income tax (a) Provision for income tax of RO 48,426 has been made (30 June 2019: RO 98,798) for the Parent Company since the Parent company has net taxable profit for the year after giving due consideration to adjustments for potential allowances and disallowances in accordance with the fiscal regulations of the Sultanate of Oman. The Group's tax provision for the current year of RO 59,471 (30 June 2019: RO 145,456) is related to the Parent company's and subsidiary's taxable profits. THL and TDB are registered in the UAE and are not subject to taxation. (b) For disclosure in the separate and consolidated statement of profit or loss Group Year ended 30 June 2020 Parent Company Year ended 30 June 2020 Group Year ended 30 June 2019 Parent Company Year ended 30 June 2019 Current tax 48,426 Income tax Additional tax demand for prior years Deferred tax (credit)/charge 59,471 2,747 (100,022) (37,804) 146,456 84,493 (13,594) 217,355 98,798 43,183 6,620 148,601 (4,677) 43,749 (c) The movement in provision for income tax for the year is as follows: Group 30 June 2020 Parent Company 30 June 2020 Group 30 June 2019 Parent Company 30 June 2019 134,089 48,426 Opening balance Provision for the year Prior year's tax demand Payments during the year Closing balance 220,344 59,471 2,747 (230,984) 51,578 204,720 146,456 84,493 (215,325) 220,344 114,941 98,798 43,183 (122,833) 134,089 (141,982) 40,533 Al Fajar Al Alamia Company SAOG and its subsidiaries Notes to the separate and consolidated financial statements for the year ended 30 June 2020 (Expressed in Omani Rial) 13 Inventories Group 30 June 2020 Parent Company 30 June 2020 Group 30 June 2019 Parent Company 30 June 2019 Raw materials and spares 993,945 695,321 1,085,954 781,701 Finished goods 694,269 694,269 463,928 463,928 Gabbro rock (b) 654,459 221,116 Goods-in-transit 69,932 69,932 149, 152 149, 152 2,412,605 1,459,522 1,920, 150 1,394,781 Less: provision for obsolete and slow moving inventories (135,644) (106,497) (123,423) (97,396) 2,276,961 1,353,025 1,796,727 1,297,385 (a) The movement in provision for obsolete and slow-moving inventories is as follows: Parent Parent Group Company Group Company 30 June 30 June 30 June 30 June 2020 2020 2019 2019 Opening balance 123,423 97,396 106,383 84,402 Charge for the year Note (26) 12,222 9,101 17,040 12,994 Closing balance 135,645 106,497 123,423 97,396 (b) The gabbro rock inventories' quantity has been valued by an external valuer as at 30 June 2020 and valued based on the weighted average cost and comprises expenditure incurred in the normal course of business in bringing inventories to their present location and condition. 14 Trade and other receivables Parent Parent Group Company Group Company 30 June 30 June 30 June 30 June 2020 2020 2019 2019 Trade receivables (gross) 13,412,270 1,223,443 13,489,176 864,979 Less: provision for ECL (1,588,419) (481,588) (2,009,613) (484,807) Trade receivables (net) 11,823,851 741,855 11,479,563 380,172 Due from subsidiaries 283,955 413,362 Due from related parties (gross) 3,749,042 540,652 1,678,731 435,581 Less: provision for ECL (21,146) (21,146) Due from related parties (net) 3,749,042 540,652 1,657,585 414,435 Retentions receivable 392,706 547,014 Contract assets 610,435 265,788 Advances to suppliers 216,008 16,701 92,559 20,761 Prepayments 677,217 552,842 559,655 87,538 Other receivables 113,996 40,851 70,572 40,465 17,583,255 2,176,855 14,672,736 1,356,733 The following is the reconciliation of total operating lease commitments at 30 June 2019 to the lease liabilities recognised on 1 July 2019: Parent Group Company Amount in RO Amount in RO Total operating lease commitments at 30 June 2019 Discounted using incremental borrowing rate Total operating lease liability recognised under IFRS 16 at 1 July 2019 251,766 (9,439) 242,327 148,448 (24,481) 123,967 Right-of-use asset and corresponding lease liability have been recognised for the Parent company's and the Group's long-term land leases ranging for a period from 5 years to 25 years, discounted using an incremental borrowing rate of 5.75%. (Expressed in Omani Rial) 10 Investment in subsidiaries (continued) (h) During the previous year ended 30 June 2019, Geodynamic's legal status has been changed from a limited liability company to a sole proprietorship establishment with Fujairah Holdings LLC owning 100% of Geodynamics. Geodynamics has also entered into a tripartite management agreement in July 2018 with Fujairah Holdings LLC and the Parent Company. Under the agreement, Fujairah Holdings LLC has appointed the Parent company to undertake various management services for Geodynamics. However, the Parent Company does not have control over Geodynamics and, therefore, is not consolidated with that of the Parent Company with effect from 1 July 2018. The Parent Company is also entitled to a management fee of 22% of Geodynamics's revenue on commencement of its operations. The management fee is however sub-ordinated to the annual license fee, which is payable to Fujairah Holdings LLC under the agreement. (1) Investment in subsidiaries have been set-off against the share capital and reserves of the subsidiaries in the consolidated financial statements. (1) The Parent Company's investments in subsidiaries are carried at cost. The management of the Parent Company has performed an impairment testing of its investments in the subsidiaries as follows: Techrock Al Andalos Al Musdaq Total and TDB Carrying amount of inve: 31,244,157 2,500,000 1,711,406 4,082,925 39,538,488 Awam Present value 33,318,937 Excess of present value 2,074,780 2,504,437 4,437 2,909,600 1,198,194 9,871,452 5,788,527 48,604,427 9,065,938 * based on projected cash flows (discounted at weighted average cost of capital). Based on the above, no impairment has been considered by the management as at 30 June 2020. G) The fair values of the assets and liabilities acquired, the consideration paid and goodwill arising (refer Note 11) from these acquisitions are as follows: Fair value of assets and liabilities Held by the Parent Company Held by Techrock acquired: Techrock Al Musdaq TDB Al Andalos Total 743,324 Assets Liabilities Net fair values 12,207,044 (3,604,701) 8,602,343 3,399,965 (2,167,408) 1,232,557 5,440, 102 (1,222,701) 4,217,401 21,790,435 (6,994,810) 14,795,625 743,324 Consideration paid: Cash and cash equivalents Non-cash consideration 9,834,034 2,700,000 6,165,966 2,500,000 21,200,000 10,131,268 19,965,302 6,352,332 12,518,298 16,483,600 37,683,600 2,700,000 2,500,000 Goodwill arising 11,362,959 1,467,443 8,300,897 1,756,676 22,887,975 Cash Al Fajar Al Alamia Company SAOG and its subsidiaries Notes to the separate and consolidated financial statements for the year ended 30 Ju (Expressed in Omani Rial) 41 Notes supporting the separate and consolidated statement of cash flows (continued) Group (2018-2019) Non-cash changes Foreign Fair value inflows/lout Acquisition exchangel changes Particulars 1 July 2018 flows) movement 30 June 2019 Long-term loans 5,818,002 (1,125,860) 4,692,142 Finance leases 247,031 (195,624) 51,407 Bank borrowings 5,159,996 2,493,830 7,653,826 Dividends paid (607,687) Finance costs (1,059,646) Parent Company (2019-2020) Non-cash changes Cash Foreign Fair value inflows/(out Acquisition exchange changes Particulars 1 July 2019 flows) movement 30 June 2020 Long-term loans 3,170,255 2,901,432 6,071,687 Finance leases 50,830 2,249,578 2,300,408 Bank borrowings 1,818,851 732,609 2,551,460 Lease liabilities 123,967 (15,620) 108,347 Dividends paid (246,651) Finance costs (647,172) Parent Company (2018-2019) Non-cash changes Cash Foreign Fair value inflows/(out) Acquisition exchangel changes Particulars 1 July 2018 flows) movement 30 June 2019 Long-term loans 4,640,315 (1,470,060) 3,170,255 Bank borrowings 1,301,202 517,649 1,818,851 Dividends paid (493,303) Finance costs (486,504) 36 Financial assets and liabilities and risk management (continued) (c) Capital management (continued) Group 30 June 2020 Parent Company 30 June 2020 Group 30 June 2019 Parent Company 30 June 2019 3,170,255 4,692, 142 50,830 Long-term loans Finance leases Lease liabilities Bank borrowings Less: cash and bank balances Net debt 8,516,006 2,300,408 208,344 13,385,781 (744,533) 23,666,007 6,071,687 2,300,408 108,347 4,411,956 (58,066) 12,834,333 10,445,292 (247,413) 14,940,851 3,035,600 (10,895) 6,194,960 Share capital Share premium Legal reserve Special reserve Retained earnings Total capital 4,933,025 13,550,576 1,391,007 579,717 5,750,040 26,204,365 4,933,025 13,550,576 1,294,851 579,717 5,419,413 25,777,582 4,933,025 13,550,576 1,365,979 579,717 5,880,664 26,309,961 4,933,025 13,550,576 1,269,823 579,717 5,440,816 25,773,957 49,870,372 38,611,915 41,250,812 31,968,917 Total capital and net debt Gearing ratio 33% 36% 19% The Parent Company and the Group's activities expose it to a variety of financial risks: market risk, credit risk and liquidity risk. June 2020 (Expressed in Omani Rial) 14 Trade and other receivables (continued) (e) The movement in provision for ECL of impaired trade receivables is as follows: Parent Parent Group Company Group Company 30 June 30 June 30 June 30 June 2020 2020 2019 2019 Opening balance 2,009,613 484,807 1,561,649 405,696 Adjustment due to the first-time adoption of IFRS 9 342,579 (21,885) At 1 July 2,009,613 484,807 1,904,228 383,811 Charge for the year 88,333 226,695 100,996 Reversed during the year (Note 27) (496,005) (3,219) (104,168) Written-off during the year (13,522) (17,142) Closing balance 1,588,419 481,588 2,009,613 484,807 (f) 35% of the Group's trade receivables are from 6 customers (30 June 2019 : 39% from 6 customers). 82% of the Parent company's trade receivables are due from 3 customers (30 June 2019: 81% due from 3 customers). (3) The Group's trade receivables are assigned on an on-going basis to a local commercial bank against borrowing facilities availed by the Group (Note 20). (h) 8% and none (2019 : 21% and 16% ) of the Group's and Parent Company's trade receivables respectively are secured against post-dated and security cheques received from the customers against their dues. (h) During the year, an ECL provision amounting to RO 21,146 on related party balances has been reversed in the separate and consolidated financial statements. (1) During the year, the Parent Company and the Group has revised the ECL provisioning on legal cases which are in the Parent company's or the Group's favour and are in the enforcement phase. Enforcement phase Within 1 year 1-2 years 2-4 years Above 4 years Earlier estimates 50% 754 100% 100% Revised estimates 33% 67% 100% Amount of receivables as at 30 June 2020 Total Parent Company Group 1,095,166 7,060 1,102,226 Total 1,095,166 7,060 1,102,226 ECL provision as per earlier estimates Parent Company Group 547,583 7,060 554,643 Total 547,583 7,060 554,643 ECL provision as per revised estimates Parent Company Group 32,855 4,730 37,585 Total 32,855 4,730 37,585 Increase in profit due to change in estimates Parent Company Group 514,728 2,330 517,058 Total 514,728 2,330 517,058 Al Fajar Al Alamia Company SAOG and its subsidiaries Notes to the separate and consolidated financial statements for the year ended 30 June 2020 (Expressed in Omani Rial) Total 75,829 110,921 186,750 23,565 16,174 39,739 147,011 Total 8 Intangible assets (continued) (a) The movement in intangible assets of the Group is as set out below: Group Year 2018-2019 Stripping Computer activity asset software Cost At 30 June 2018 56,829 19,000 Additions during the year 109,543 1,378 At 30 June 2019 166,372 20,378 Accumulated amortisation At 30 June 2018 19,890 3,675 Charge for the year 11,366 4,808 At 30 June 2019 31,256 8,483 Net book amount At 30 June 2019 135, 116 11,895 (b) The movement in intangible assets of the Parent company is as set out below: Parent Company Computer Year 2019-2020 software Cost At 30 June 2019 6,378 At 30 June 2020 6,378 Accumulated amortisation At 30 June 2019 2,037 Charge for the year 1,595 At 30 June 2020 3,632 Net book amount At 30 June 2020 2,746 Parent Company Computer Year 2018-2019 software Cost At 30 June 2018 5,000 Additions during the year 1,378 At 30 June 2019 6,378 Accumulated amortisation At 30 June 2018 729 Charge for the year 1,308 At 30 June 2019 2,037 Net book amount At 30 June 2019 4,341 6,378 6,378 2,037 1,595 3,632 2,746 Total 5,000 1,378 6,378 729 1,308 2,037 4,341 Ic For acquisition of mining rights and relevant amortisation refer Note 10e Al Fajar Al Alamia Company SAOG and its subsidiaries Notes to the separate and consolidated financial statements for the year ended 30 June 2020 (Expressed in Omani Rial) 14 Trade and other receivables (continued) a) Trade receivables are generally on 30 to 120 days' credit terms and are stated at amortised cost. They are recognised at the original amounts which represent their fair values on initial recognition. b) The maximum exposure to credit risk at the reporting date is the fair value of each class of receivable mentioned above. c) The Parent Company and the Group applies the IFRS 9 simplified approach to measure ECL using a lifetime ECL provision for trade receivables. To measure ECL on a collective basis, trade receivables are grouped based on similar credit risk and aging. The ECL rates are based on the Company's historical credit losses. The historical losses are then adjusted for the current and forward-looking information on macro-economic factors affecting the Company's customers. d) The lifetime ECL provision for trade receivables is as follows: i) Group At 30 June 2019, the ageing and the lifetime ECL provision for trade receivables is as follows: Between 180 and 365 More than 365 Upto 180 days days days past due Total Gross carrying amount 8,080,944 1,259,854 4,148,378 13,489,176 Loss provision 380,539 114,558 1,514,516 2,009,613 ii) Group At 30 June 2020, the ageing and the lifetime ECL provision for trade receivables is as follows: Between 180 and 365 More than 365 Upto 180 days days days past due Total 13,412,270 1,588,419 Gross carrying amount 5,977,113 2,117,975 5,317,182 Loss provision 58,521 98,739 1,431,159 ii) Parent Company At 30 June 2019, the ageing and the lifetime ECL provision for trade receivables is as follows: Between 180 and 365 More than 365 Upto 180 days days days past due Total Gross carrying amount Loss provision 343,670 3,168 30,668 850 490,641 480,789 864,979 484,807 iv) At 30 June 2020, the ageing and the lifetime ECL provision for trade receivables is as follows: Between 180 and 365 More than 365 Upto 180 days days days past due Total Gross carrying amount Loss provision 343,670 3,168 30,668 850 849, 105 477,570 1,223,443 481,588 Al Fajar Al Alamia Company SAOG and its subsidiaries Notes to the separate and consolidated financial statements for the year ended 30 June 2020 (Expressed in Omani Rial) 17 Trade and other payables Group Parent Group Parent Company Company 30 June 30 June 30 June 30 June 2020 2020 2019 2019 645,252 672,896 2,635,301 113,349 2,947,852 17,118 2,485,693 Trade payables Advances from customers Due to a subsidiary (Note 16) Due to a related party (Note 16) Due to an associate (Note 16) Other payables and accruals 3,929,657 61,938 521,211 1,644,259 4,976,058 521,211 331,307 3,983,463 30,842 735,604 1,166,638 4,898,054 735,604 204,925 5,543,082 Trade payables are generally settled within 30 to 60 days of the suppliers' invoice date and are denominated in RO and AED. 18 share capital and share premium (a) The authorised share capital of the Parent Company, registered with the Ministry of Commerce and Industry, is RO 12,000,000, comprising of 120,000,000 shares of RO 0.100 each (30 June 2019: RO 12,000,000, comprising of 120,000,000 shares of RO 0.100 each). The issued and fully paid-up share capital of the Parent company consists of 49,330,250 shares (30 June 2019: 49,330,250 shares) of RO 0.100 each (30 June 2019: RO 0.100 each). The Parent Company has only one class of ordinary shares, which rank equally with regards to the Parent Company's residual assets. The holders of ordinary shares are entitled to receive dividends as declared from time to time and are entitled to one vote per share at the Parent Company's meetings. (b) The details of shareholders who own 5% or more of the Parent Company's shares whether in their names or through a nominee account are as follows: Name of the shareholder 30 June 2020 % of total Number of capital shares 30 June 2019 % of total Number of capital shares Ms Muna Noor Brian Ritchie Al Maha Financial Services LLC Maryam International LLC The Sultan's Special Forces Pension Fund Muna Noor International LLC Salim International Investment Holding LLC 27.31 19.08 17.91 10.14 8.11 13,472,461 9,411,428 8,833,333 5,000,000 3,999,980 15.07 19.08 20.27 10.14 8.11 7,432,542 9,411,428 10,000,000 5,000,000 3,999,980 6.31 3,113,800 6.31 3,113,800 (c) The Parent Company has issued 29,330,250 shares of RO 0.100 each in the year 2010 to the shareholders of Techrock at an estimated fair value of RO 0.562 each, resulting in a share premium of RO 0.462 on each share amounting to RO 13,550,576 (Note 10 (1)). 21 Finance leases Group 30 June 2020 Parent Company 30 June 2020 Group 30 June 2019 Parent Company 30 June 2019 Finance leases 2,300,408 2,300,408 Less: current portion of finance leases (494,487) (494,487) 50,830 Non-current portion of finance leases 1,805,921 1,805,921 Present value of minimum lease payments 1,311,435 1,311,435 50,830 The finance leases which were obtained from a financial institution for the purchase of plant and machinery are denominated in RO and bears commercial rate of interest. The finance lease is secured against the plant and machinery, corporate guarantee of the Parent company and insurance of the related plant and equipment in the names of the subsidiaries and the financial institution, for which the financing was obtained (Note 7(g)). That portion of the finance leases which is repayable within 12 months of the statement of financial position date is disclosed as curent portion of finance leases. 22 Bank borrowings Parent Parent Group Company Group Company 30 June 30 June 30 June 30 June 2020 2020 2019 2019 Loan against trust receipts 6,273,816 2,171,878 5,677,759 1,818,851 Bills discounted 3,500,853 379,583 1,976,067 Bank overdrafts (Note 34) 3,611,112 1,860,495 2,791,466 1,216,749 13,385,781 4,411,956 10,445,292 3,035,600 Bank borrowings are from commercial banks in the Sultanate of Oman and bear interest at commercial rates. The interest rates are subject to re-negotiation with the banks upon renewal of the facilities, which generally takes place on an quarterly basis. The bank borrowings are either repayable on demand or within 180 days of the separate and consolidated statement of financial position date. The details of securities on the bank borrowings have been disclosed in Note 20 (8) Al Fajar Al Alamia Company SAOG and its subsidiaries Notes to the separate and consolidated financial statements for the year ended 30 June 2020 (Expressed in Omani Rial) 8 Intangible assets (continued) (d) Allocation of the amortisation charge for the year in the separate and consolidated statement of profit or loss is as follows: Group Year ended 30 June 2020 Parent Company Year ended 30 June 2020 Group Year ended 30 June 2019 Parent Company Year ended 30 June 2019 Cost of revenue (Note 26) Expenses 33,274 4,907 38,181 1,595 1,595 11,366 4,808 16,174 1,308 1,308 9 Leases a) Right-of-use asset Group 30 June 2020 Parent Company 30 June 2020 Group 30 June 2019 Parent Company 30 June 2019 Impact of first time adoption of IFRS 16 Less: amortisation charge for the year Closing balance b) Liabilities 242,327 (40,056) 202,271 123,967 (19,163) 104,804 Group 30 June 2020 Parent Company 30 June 2020 Group 30 June 2019 Parent Company 30 June 2019 Impact of first time adoption of IFRS 16 Add: interest expense Less: lease payments Add: prepayments Closing balance 242,327 13,697 (49,555) 1,875 208,344 123,967 8,060 (25,555) 1,875 108,347 Lease liabilities Less: current portion of lease liabilities Non-current portion of lease liabilities 208,344 (43,127) 165,217 108,347 (23,680) 84,668 Group Under the Group, Techrock has leased an industrial land located at Sohar amounting to RO 24,000 per annum from Mr. Khamis bin Saif bin Zahran Alyarubi for a period of 10 years expiring in 28 February 2025. Parent Company The Parent Company has leased 6 plots of land located at Sohar and Thumrait amounting to RO 23,680 per annum from Oman Mining Company LLC and Mining of Housing for a periods of 5-25 years expiring in 31 December 2032. (Expressed in Omani Rial) 467 23 Employees' benefit liabilities Parent Parent Group Company Group Company 30 June 30 June 30 June 30 June 2020 2020 2019 2019 Opening balance 953,504 326,058 900,375 307,670 Provision for the year 111,328 53,898 123,481 27,193 Transferred from subsidiaries (net) 25,104 (3,097) Payments during the year (23,428) (4,605) (63,936) (8,805) Relating to disposal of subsidiary (3,319) Closing balance 1,066,509 375,351 953,504 326,058 Number of employees 497 72 72 24 Dividends paid and proposed (a) Subsequent to the end of the reporting period, the Board of Directors have proposed a cash dividend of Nil (30 June 2019: 5%) of the issued and fully paid-up share capital amounting to RO Nil (30 June 2019: RO 246,651), which is subject to the shareholders' approval at the Annual General Meeting. Dividend per share is calculated by dividing the dividend proposed to be distributed to the shareholders by the number of shares outstanding at the date of the separate and consolidated statement of financial position as follows: Parent Company 30 June 30 June 2020 2019 Proposed dividend 246,651 Number of shares outstanding 49,330,250 49,330,250 Dividend per share 0.005 (b) In accordance with Section 28A of the Articles of THL, an amount of RO 59,328 (30 June 2019: RO 114,384) has been paid by THL to Mr. Abdulla Ahmad Abdulla Adbdulhoul (Class A shareholder) dividends during the year ended 30 June 2020 for the year ended 30 June 2019 based on a resolution passed on 28 August 2019. 25 Revenue from contracts with customers Parent Parent Group Company Group Company Year ended Year ended Year ended Year ended 30 June 30 June 30 June 30 June 2020 2020 2019 2019 Over a period of time: - in the Sultanate of Oman: Drilling and blasting services 5,192,820 10,004,785 - in the United Arab Emirates Drilling and blasting services 8,544,818 9,354,328 Point-in-time: - in the Sultanate of Oman: Sale of explosives 1,029,195 3,939, 142 741,072 5,566,023 Sale of gabbro rock 1,457,887 1,457,887 144,931 144,931 16,224,720 5,397,030 20,245, 116 5,710,954 7 Property, plant and equipment (continued) (d) The movement in property, plant and equipment of the Parent Company is as set out below: Parent Company Year 2018-2019 Office equipment, furniture and fixtures Plant and machinery Portable magazines Storage and caravans Tools and equipment Motor vehicles Buildings Capital work-in- progress Total 1,599,728 85,190 17,461 45,550 Cost At 30 June 2018 Additions during the year At 30 June 2019 563,134 7,207 570,341 45,501 12,880 58,381 88,619 12,247 100,866 203,207 203,207 2,445,183 235,541 2,680,724 1,599,728 85,190 17,461 45,550 Accumulated depreciation At 30 June 2018 Charge for the year At 30 June 2019 45,550 937,674 127,372 1,065,046 419,474 23,045 442,519 82,720 2,280 85,000 14,912 2,089 17,001 42,193 2,432 44,625 79,169 7,095 86,264 1,621,692 164,313 1,786,005 45,550 Net book amount At 30 June 2019 534,682 127,822 190 460 13,756 14,602 203,207 894,719 Al Fajar Al Alamia Company SAOG and its subsidiaries Notes to the separate and consolidated financial statements for the year ended 30 June 2020 (Expressed in Omani Rial) Segment reporting (continued) Parent Company Explosive manufacturing and trading Un-allocable 30 June 2020 Mining 30 June 2020 30 June 2019 30 June 30 June 2019 30 June 2019 Total 30 June 2020 30 June 2019 2020 External revenue - Local sales - UAE sales 1,029, 196 741,072 1,457,887 144,931 2,487,083 886,003 Total external revenue 741,072 1,457,887 144,931 2,487,083 886,003 Inter-segment sales 1,029,196 2,158,476 3,187,672 4,824,951 751,471 2,909,947 4,824,951 Total revenue 5,566,023 2,209,358 144,931 5,397,030 5,710,954 Segment gross profit 190,735 1,893,279 1,457,887 48,531 1,648,622 1,941,810 -Other income -Overheads -Finance costs 84,009 535,535 (478,305) 81,402 (976,964) (293,065) (983,534) (3,573) (343,433) (168,868) (74,800) (193,439) 84,009 (791,432) (647,172) 81,402 (1,055,337) (486,504) Segment result 331,974 704,652 474,353 44,958 (512,301) (268,239) 294,026 481,371 Taxation 25,280 (141,857) (69,029) (6,744) (43,749) (148,601) Net profit for the year 357,254 562,795 405,324 38,214 (512,301) (268,239) 250,277 332,770 4,735,468 3,978,851 175,004 33,329 4,910,472 4,012,180 37,038,488 32,955,563 Segment assets Investment in an assoicate Investment in subsidiaries Goodwill Due from related parties Total assets 579,717 540,651 5,855,837 579,717 435,581 4,994, 149 37,038,488 579,717 540,651 43,069,328 32,955,563 579,717 435,581 37,983,041 175,004 33,329 37,038,488 32,955,563 16,621 16,176 6,278,047 3,170,255 Segment liabilities Taxation Due to related parties Total liabilities 7,949,641 40,533 3,006,904 10,997,078 4,223,303 134,089 4,665,261 9,022,653 14,244,309 40,533 3,006,904 17,291,746 7,409,734 134,089 4,665,261 12,209,084 16,621 16,176 6,278,047 3,170,255 Task. Almost all formula available below. Please help me and just find and put the values only from given statements (Ex. Earnings 212121, average inventory=121212, equity ratio=10210.) After that leave the calculation for me. Hope you understand the task. Thanks I love to upvote. 1. ROCE = Earnings before interest and tax/ (Total assets - Current liabilities) 2. Current Ratio=Current Assets/Current liabilities 3. Quick Ratio (Acid Test Ratio)=Cash+Marketable securities Receivable/Current Liabilities 4. Operating cash flow to current liabilities ratio = Cash flow from operations / Current liabilities 5. A\R turnover = Credit sales / Average accounts receivable 6. Inventory turnover = Cost of goods sold / Average inventory 7. Accounts payable turnover = Credit purchases / Average accounts payable 8. Interest coverage ratio = Earnings before interest and tax/Interest expense 9. Long-term debt ratio = Long-term debt/Shareholders' equity 10. Debt / equity ratio = Total debt / Shareholders' equity 11. Long-term debt to assets ratio = Long-term debt/Total assets 12. Interest coverage ratio = Earnings before interest and tax/Interest expense 13. Operating cash flow to total liabilities ratio = Cash flow from operations / Total liabilities 14. Earnings per share (EPS) = (Net income - Preferred dividends) / Weighted average number of shares outstanding 15. Altman's Z-Score = (1.2 * A) + (1.4* B)+(3.3 * C) + (0.6*D) + (0.999* E) Where A = (Current assets - Current liabilities)/ Total assets B = Retained Earnings / Total assets C = Earnings before interest and tax/Total assets D = Book value of equity/Total liabilities E = Sales/ Total assets 30-Jun-20 - 30-Jun-19 - Group Parent Group Parent PBT 162579 294026 2019060 481371 Add:- Interest 1287707 647172 1031796 486504 EBIT (A) 1450286 941198 3050856 967875 Total Asset (B) 56709049 43069328 47570127 37983041 Current Liab. (C) 20457174 10021431 17155958 9957209 Capital Employed (D) [B-C] 36251875 33047897 30414169 28025832 Current Asset (E) 21553646 3587946 17327310 2665013 Inventory (F) 2276961 1353025 1796727 1297385 Quick Asset (G) [E-F] 19276685 2234921 15530583 1367628 Operating Cash Flow (H) -827626 -1434258 3758745 3415245 Total liabilities (1) 56709049 43069328 47570127 37983041 ROCE (A/D) 4% 3% 10% 3% Current Ratio (E/C) 1.1 0.4 1.0 0.3 Quick Ratio (G/C) 0.94 0.22 0.91 0.14 Operating Cash Flow to CL (H/C) -4% -14% 22% 34% Operating Cash Flow to TL (H/1) - 1% -3% 8% 9% Al Fajar Al Alamia Company SAOG and its subsidiaries Separate and consolidated statement of financial position as at 30 June 2020 (Expressed in Omani Rials) Note Group Parent Company 30 June 30 June 2020 2020 Group 30 June 2019 Parent Company 30 June 2019 ASSETS Non-current assets Property, plant and equipment 7 7,811,838 864,727 6,688,122 894,719 Right-of-use asset 9 202,271 104,804 Intangible assets 8 3,631,053 2,746 147,011 4,341 Investment in subsidiaries 10 37,038,488 32,955,563 Investment in an associate 12 870,139 870,139 867,604 867,604 Goodwill 11 22,228,249 579,717 22,228,249 579,717 Deferred tax asset 32 411,853 20,761 311,831 16,084 Total non-current assets 35,155,403 39,481,382 30,242,817 35,318,028 Current assets Inventories 13 2,276,961 1,353,025 1,796,727 1,297,385 Trade and other receivables 14 17,583,255 2,176,855 14,672,736 1,356,733 Debt instruments at amortised cost 15 948,897 610,434 Cash and bank balances 34 744,533 58,066 247,413 10,895 Total current assets 21,553,646 3,587,946 17,327,310 2,665,013 Total assets 56,709,049 43,069,328 47,570,127 37,983,041 EQUITY AND LIABILITIES Shareholders' capital and reserves Share capital 18 4,933,025 4,933,025 4,933,025 4,933,025 Share premium 18 13,550,576 13,550,576 13,550,576 13,550,576 Legal reserve 19 1,391,007 1,294,851 1,365,979 1,269,823 Special reserve 19 579,717 579,717 579,717 579,717 Retained earnings 5,750,040 5,419,413 5,880,664 5,440,816 Total shareholders' capital and reserves 26,204,365 25,777,582 26,309,961 25,773,957 Non-current liabilities Non-current portion of long-term loans 20 7,009,863 5,004,375 3,150,704 1,925,817 Non-current portion of finance leases 21 1,805,921 1,805,921 Non-current portion of lease liabilities 165,217 84,668 Employees' benefit liabilities 23 1,066,509 375,351 953,504 326,058 Total non-current liabilities 10,047,510 7,270,315 4,104,208 2,251,875 Current liabilities Trade and other payables 17 4,976,058 3,983,463 4,898,054 5,543,082 Bank borrowings 22 13,385,781 4,411,956 10,445,292 3,035,600 Current portion of long-term loans 20 1,506,143 1,067,312 1,541,438 1,244,438 Current portion of finance leases 21 494,487 494,487 50,830 Current portion of lease liabilities 43,127 23,680 Provision for taxation 32 51,578 40,533 220,344 134,089 Total current liabilities 20,457,174 10,021,431 17,155,958 9,957,209 Total liabilities 30,504,684 17,291,746 21,260,166 12,209,084 Total shareholders' capital and reserves and liabilities 56,709,049 43,069,328 47,570,127 37,983,041 Net asset per share 33 0.531 0.523 0.533 0.522 These separate and consolidated financial statements, set out on pages 7 to 65, were approved and authorised for issue by the Board of Directors on 26 August 2020 and were signed on their behalf by: Al Fajar Al Alamia Company SAOG and its subsidiaries Separate and consolidated statement of cash flows for the year ended 30 June 2020 (Expressed in Omani Rials) Group 30 June 2020 Parent Company 30 June 2020 Group 30 June 2019 Parent Company 30 June 2019 Notes 162,579 294,026 2,019,060 481,371 7 1,055,850 38,181 125,757 1,595 944,870 16,174 164,313 1,308 8 27 (5,300) 23,131 40,056 9 19,163 12 6,099 6,099 14,396 14,396 Operating activities Net profit before tax for the year Adjustments for: Depreciation of property, plant and equipment Amortisation of intangible assets Profit on sale of property, plant and equipment Write-off of property, plant and equipment Amortisation of right-of-use asset Share of loss from investment in an associate Provision for obsolete and slow- moving inventories Provision for expected credit losses on trade receivables Reversal of excess ECL provision on trade receivables (Note 14) Reversal of ECL provision on related party receivables Finance costs Provision for employees' benefit liabilities Operating profit before working capital changes 12,222 9,101 17,040 12,994 30 88,333 230,253 100,996 27 (496,005) (3,219) (104,168) 27 31 (21,146) 1,287,707 (21,146) 647,172 1,031,796 486,504 23 136,433 53,898 120,384 27,193 2,328,139 1,132,445 4,289,805 1,289,075 (492,456) (2,486,902) 78,004 (64,741) (795,757) (1,559,619) 95,459 (2,011,808) 1,667,869 (103,408) 201,996 2,159,220 Working capital changes Inventories Trade and other receivables Trade and other payables Cash generated from/(used in) operating activities Less: employees' benefit liabilities paid Less: income tax paid Net cash (used in)/generated from operating activities (573,214) (23,428) (230,984) (1,287,672) (4,605) (141,981) 4,041,325 (67,255) (215,325) 3,546,883 (8,805) (122,833) 32 (827,626) (1,434,258) 3,758,745 3,415,245 Al Fajar Al Alamia Company SAOG and its subsidiaries Separate and consolidated statement of cash flows for the year ended 30 June 2020 (Expressed in Omani Rials) Group 30 June 2020 Parent Company 30 June 2020 Group 30 June 2019 Parent Company 30 June 2019 Notes 7 (2,202,697) (95,765) (2,079,693) (235,541) 7 10,500 (3,522,223) 8 (110,921) (1,378) 12 (750,000) Investing activities Purchase of property, plant and equipment Proceeds from sale of property, plant and equipment Cost of acquisition of intangible assets Cost of acquisition of investment in an associate Costs paid for operating rights for license Cost of acquisition of investment in a subsidiary Net movement in debt instruments at amortised cost Net cash used in investing activities (750,000) 12 (8,634) (8,634) (132,000) (132,000) 10 (4,082,925) 15 (338,463) (489,684) (6,061,517) (4,187,324) (3,562,298) (1,118,919) (1,470,060) (1,125,860) (195,624) 2,493,830 517,649 Financing activities Net movement in long-term loans Net movement in finance leases Net movement in bank borrowings Lease liabilities paid (principal) Dividends paid 24 Finance costs paid 31 Net cash from/(used in) financing activities 3,823,864 2,249,578 2,120,842 (33,983) (305,979) (1,287,707) 6,566,616 2,901,432 2,300,408 732,609 (15,620) (246,651) (647,172) 5,025,007 (607,687) (1,031,796) (467,137) (493,303) (486,504) (1,932,218) (322,527) (596,575) (270,690) 364,108 Net decrease/(increase) in cash and cash equivalents Cash and cash equivalents, beginning of the year Cash and cash equivalents, end of the year (2,544,053) (1,205,854) (2,273,363) (1,569,962) 34 (2,866,580) (1,802,429) (2,544,053) (1,205,854) Disclosure as required by IAS 7 "Statement of Cash Flows" has been shown in Note 41 to the separate and consolidated financial statements. Al Fajar Al Alamia Company SAOG and its subsidiaries Separate and consolidated statement of cash flows for the year ended 30 June 2020 (Expressed in Omani Rials) Group 30 June 2020 Parent Company 30 June 2020 Group 30 June Parent Company 30 June 2019 Notes 2019 162,579 294,026 2,019,060 481,371 7 1,055,850 38,181 8 1,595 16,174 1,308 27 (5,300) 9 23,131 40,056 19,163 12 6,099 6,099 14,396 14,396 Operating activities Net profit before tax for the year Adjustments for: Depreciation of property, plant and equipment Amortisation of intangible assets Profit on sale of property, plant and equipment Write-off of property, plant and equipment Amortisation of right-of-use asset Share of loss from investment in an associate Provision for obsolete and slow- moving inventories Provision for expected credit losses on trade receivables Reversal of excess ECL provision on trade receivables (Note 14) Reversal of ECL provision on related party receivables Finance costs Provision for employees' benefit liabilities Operating profit before working capital changes 13 12,222 9,101 17,040 12,994 30 88,333 230,253 100,996 27 (496,005) (3,219) (104,168) 27 31 (21,146) 1,287,707 (21,146) 647,172 1,031,796 486,504 23 136,433 53,898 120,384 27,193 2,328,139 1,132,445 4,289,805 1,289,075 (492,456) (2,486,902) 78,004 (64,741) (795,757) (1,559,619) 95,459 (2,011,808) 1,667,869 (103,408) 201,996 2,159,220 Working capital changes Inventories Trade and other receivables Trade and other payables Cash generated from/(used in) operating activities Less: employees' benefit liabilities paid Less: income tax paid Net cash (used in)/generated from operating activities (573,214) (23,428) (230,984) (1,287,672) (4,605) (141,981) 4,041,325 (67,255) (215,325) 3,546,883 (8,805) (122,833) 32 (827,626) (1,434,258) 3,758,745 3,415,245 Al Fajar Al Alamia Company SAOG and its subsidiaries Separate and consolidated statement of cash flows for the year ended 30 June 2020 (Expressed in Omani Rials) Group 30 June 2020 Parent Company 30 June 2020 Group 30 June 2019 Parent Company 30 June 2019 Notes 7 (2,202,697) (95,765) (2,079,693) (235,541) 7 8 10,500 (3,522,223) (110,921) (1,378) 12 (750,000) (750,000) Investing activities Purchase of property, plant and equipment Proceeds from sale of property, plant and equipment Cost of acquisition of intangible assets Cost of acquisition of investment in an associate Costs paid for operating rights for license Cost of acquisition of investment in a subsidiary Net movement in debt instruments at amortised cost Net cash used in investing activities 12 (8,634) (8,634) (132,000) (132,000) 10 (4,082,925) 15 (338,463) (489,684) (6,061,517) (4,187,324) (3,562,298) (1,118,919) (1,470,060) (1,125,860) (195,624) 2,493,830 517,649 Financing activities Net movement in long-term loans Net movement in finance leases Net movement in bank borrowings Lease liabilities paid (principal) Dividends paid 24 Finance costs paid 31 Net cash from/(used in) financing activities 3,823,864 2,249,578 2,120,842 (33,983) (305,979) (1,287,707) 6,566,616 2,901,432 2,300,408 732,609 (15,620) (246,651) (647,172) 5,025,007 (607,687) (1,031,796) (467,137) (493,303) (486,504) (1,932,218) (322,527) (596,575) (270,690) 364,108 Net decrease/(increase) in cash and cash equivalents Cash and cash equivalents, beginning of the year Cash and cash equivalents, end of the year (2,544,053) (1,205,854) (2,273,363) (1,569,962) 34 (2,866,580) (1,802,429) (2,544,053) (1,205,854) Disclosure as required by IAS 7 "Statement of Cash Flows" has been shown in Note 41 to the separate and consolidated financial statements. June 2020 (Expressed in Omani Rial) Goodwill continued) The annual growth rate over a period of five years and the discount factors in determining the recoverable amount of goodwill related to each of the subsidiaries are as follows: Growth rate Discount rate Techrock TDB Al Andalos Al Musdaq -2.0% 4.0% 5.5% 2.0% 134 14% 15% 16% - Investment in an associate The following entity meets the definition of an associate as the Parent Company and the Group exercises significant influence over the investee company. The investment in the associate has been accounted for based on the equity method of accounting in the separate and consolidated financial statements. Proportion of voting rights held Name of the associate Country of incorporation at 30 June 2020 2019 Ahjaar Mining LLC, Oman Sultanate of Oman 30% 30% Group and Parent Company 30 June 30 June 2020 2019 Opening balance 867,604 Investment during the year 750,000 Costs paid for operating rights for license 8,634 132,000 Share of net loss for the year (6,099) (14,396) Closing balance 870,139 867,604 The results of operations and financial position of the associate as summarised from the management accounts prepared as at, and for the year ended, 30 June 2020 and 30 June 2019 are as follows: 30 June 30 June Assets 2020 2019 Total assets 2,493,901 2,452,012 Total net assets 2,431,682 2,452,
Step by Step Solution
There are 3 Steps involved in it

Get step-by-step solutions from verified subject matter experts