

Question: Please help me. Thank you! 9 Exercise 6A-4 (Static) High-Low Method; Scattergraph Analysis (L06-10] [The following information applies to the questions displayed below.) Archer Company
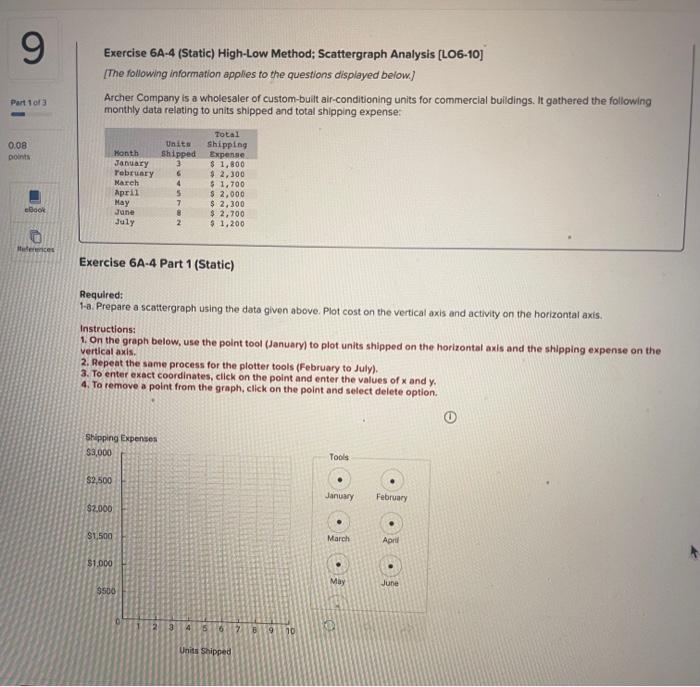
9 Exercise 6A-4 (Static) High-Low Method; Scattergraph Analysis (L06-10] [The following information applies to the questions displayed below.) Archer Company is a wholesaler of custom-built air-conditioning units for commercial buildings. It gathered the following monthly data relating to units shipped and total shipping expense: Part 1 of 3 0.08 points Honth January Tebruary March April May June July Units Shipped 3 6 4 5 7 Total Shipping Expense $ 1,800 $ 2,300 $ 1,700 $ 2,000 $ 2,300 $ 2,700 1.200 Book 2 tulences Exercise 6A-4 Part 1 (Static) Required: 1-a. Prepare a scattergraph using the data given above. Plot cost on the vertical axis and activity on the horizontal axts. Instructions: 1. On the graph below, use the point tool (January) to plot units shipped on the horizontal axis and the shipping expense on the vertical axis. 2. Repeat the same process for the plotter tools (February to July). 3. To enter exact coordinates, click on the point and enter the values of x and y 4. To remove a point from the graph, click on the point and select delete option. Shipping Expenses $3,000 Tools $2,500 January February $2.000 $1,500 March April $1,000 May June $500 2 3 4 56 7 8 9 10 Units Shipped
Step by Step Solution
There are 3 Steps involved in it

Get step-by-step solutions from verified subject matter experts