

Question: please help me that how to solve this question, thank you 1. The table below shows the quantity supplied of cups of coffee at each
please help me that how to solve this question, thank you
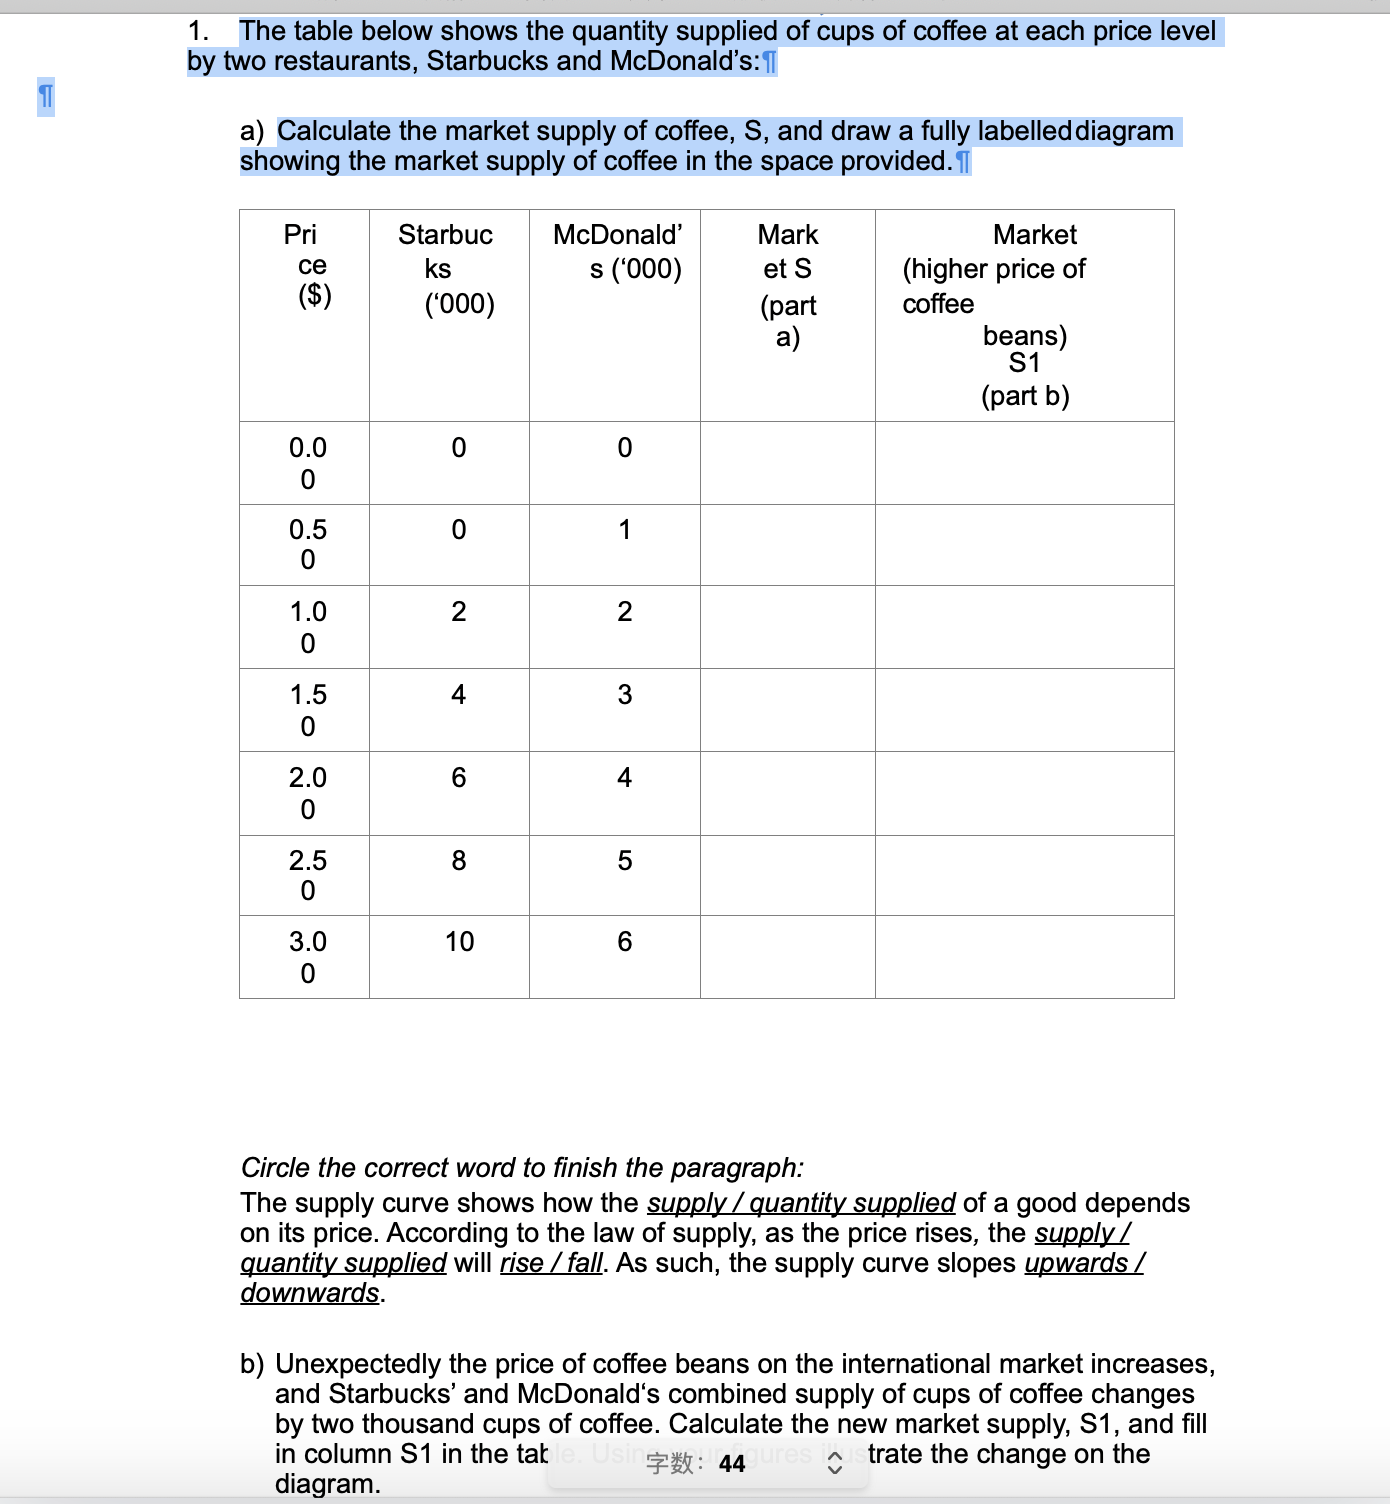
1. The table below shows the quantity supplied of cups of coffee at each price level by two restaurants, Starbucks and McDonald's:1i a) Calculate the market supply of coffee, 8, and draw a fully labelled diagram showing the market supply of coffee in the space provided.1l Pri Starbuc McDonald' Mark Market ce ks s ('000) et 8 (higher price of ($) ('000) (part coffee a) beans) 81 (part b) 0.0 0 0 0 0.5 0 1 0 1.0 2 2 0 1.5 4 3 0 2.0 6 4 0 2.5 8 5 0 3.0 10 6 0 Circle the correct word to nish the paragraph: The supply curve shows how the 1 Mt Ii of a good depends on its price. According to the law of supply, as the price rises, the W W will rise 1 fall. As such, the supply curve slopes upwards z downwards. b) Unexpectedly the price of coffee beans on the international market increases, and Starbucks' and McDonald's combined supply of cups of coffee changes by two thousand cups of coffee. Calculate the new market supply, 51, and ll in column S1 in the tat iii: 44 3 trate the change on the diagram
Step by Step Solution
There are 3 Steps involved in it

Get step-by-step solutions from verified subject matter experts