

Question: please help me this is part 2 of my 1st question i also posted there my 1st question too. There is my all assinment there
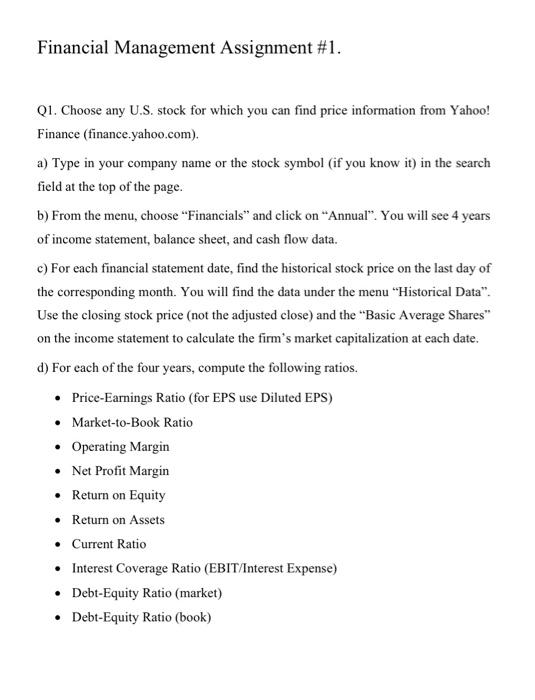
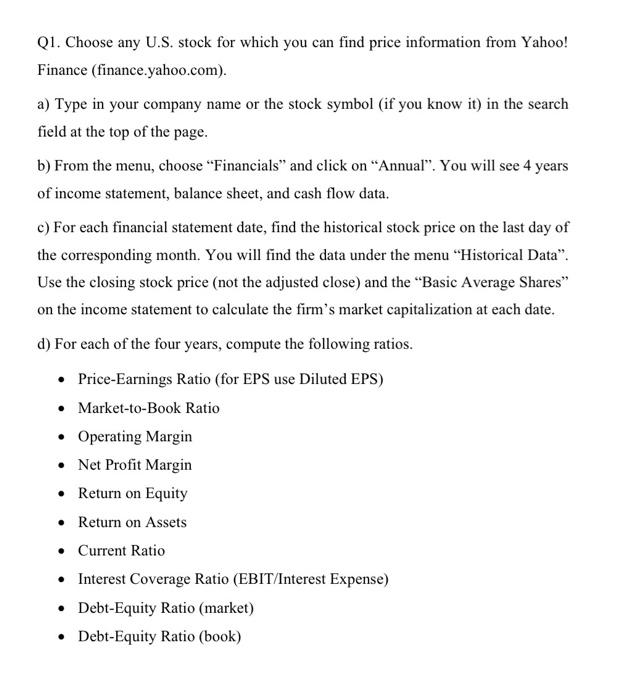
Q1. My chosen company is Apple inc. I need for each of 2019 2020 2021 2022 years, compute the following ratios.
- Price-Earnings Ratio (for EPS use Diluted EPS)
- Market-to-Book Ratio
- Operating Margin
- Net Profit Margin
- Return on Equity
- Return on Assets
- Current Ratio
- Interest Coverage Ratio (EBIT/Interest Expense)
- Debt-Equity Ratio (market)
- Debt-Equity Ratio (book)
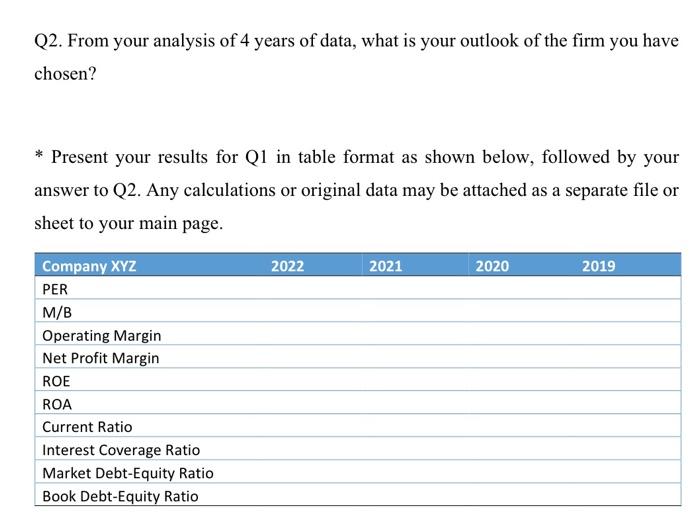
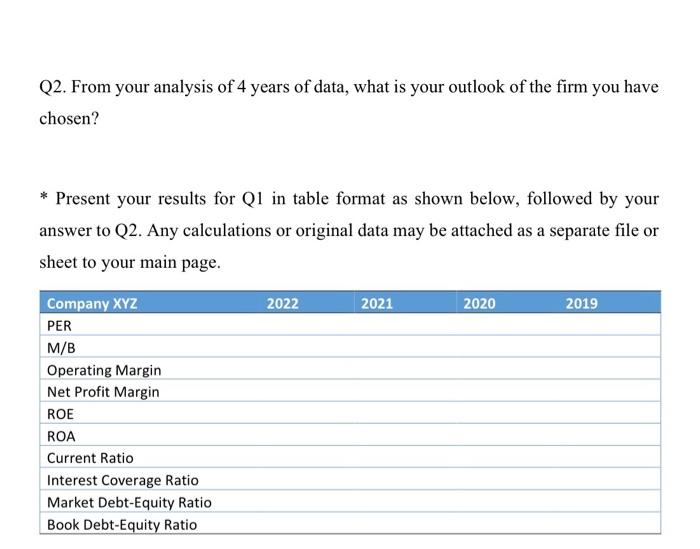
Q.2 From your analysis of 4 years of data, what is your outlook of the Apple inc.?
Q2. From your analysis of 4 years of data, what is your outlook of the firm you have chosen? * Present your results for Q1 in table format as shown below, followed by your answer to Q2. Any calculations or original data may be attached as a separate file or sheet to your main page. Financial Management Assignment \#1. Q1. Choose any U.S. stock for which you can find price information from Yahoo! Finance (finance.yahoo.com). a) Type in your company name or the stock symbol (if you know it) in the search field at the top of the page. b) From the menu, choose "Financials" and click on "Annual". You will see 4 years of income statement, balance sheet, and cash flow data. c) For each financial statement date, find the historical stock price on the last day of the corresponding month. You will find the data under the menu "Historical Data". Use the closing stock price (not the adjusted close) and the "Basic Average Shares" on the income statement to calculate the firm's market capitalization at each date. d) For each of the four years, compute the following ratios. - Price-Earnings Ratio (for EPS use Diluted EPS) - Market-to-Book Ratio - Operating Margin - Net Profit Margin - Return on Equity - Return on Assets - Current Ratio - Interest Coverage Ratio (EBIT/Interest Expense) - Debt-Equity Ratio (market) - Debt-Equity Ratio (book) Q1. Choose any U.S. stock for which you can find price information from Yahoo! Finance (finance.yahoo.com). a) Type in your company name or the stock symbol (if you know it) in the search field at the top of the page. b) From the menu, choose "Financials" and click on "Annual". You will see 4 years of income statement, balance sheet, and cash flow data. c) For each financial statement date, find the historical stock price on the last day of the corresponding month. You will find the data under the menu "Historical Data". Use the closing stock price (not the adjusted close) and the "Basic Average Shares" on the income statement to calculate the firm's market capitalization at each date. d) For each of the four years, compute the following ratios. - Price-Earnings Ratio (for EPS use Diluted EPS) - Market-to-Book Ratio - Operating Margin - Net Profit Margin - Return on Equity - Return on Assets - Current Ratio - Interest Coverage Ratio (EBIT/Interest Expense) - Debt-Equity Ratio (market) - Debt-Equity Ratio (book) Q2. From your analysis of 4 years of data, what is your outlook of the firm you have chosen? * Present your results for Q1 in table format as shown below, followed by your answer to Q2. Any calculations or original data may be attached as a separate file or sheet to your main page. Q2. From your analysis of 4 years of data, what is your outlook of the firm you have chosen? * Present your results for Q1 in table format as shown below, followed by your answer to Q2. Any calculations or original data may be attached as a separate file or sheet to your main page. Financial Management Assignment \#1. Q1. Choose any U.S. stock for which you can find price information from Yahoo! Finance (finance.yahoo.com). a) Type in your company name or the stock symbol (if you know it) in the search field at the top of the page. b) From the menu, choose "Financials" and click on "Annual". You will see 4 years of income statement, balance sheet, and cash flow data. c) For each financial statement date, find the historical stock price on the last day of the corresponding month. You will find the data under the menu "Historical Data". Use the closing stock price (not the adjusted close) and the "Basic Average Shares" on the income statement to calculate the firm's market capitalization at each date. d) For each of the four years, compute the following ratios. - Price-Earnings Ratio (for EPS use Diluted EPS) - Market-to-Book Ratio - Operating Margin - Net Profit Margin - Return on Equity - Return on Assets - Current Ratio - Interest Coverage Ratio (EBIT/Interest Expense) - Debt-Equity Ratio (market) - Debt-Equity Ratio (book) Q1. Choose any U.S. stock for which you can find price information from Yahoo! Finance (finance.yahoo.com). a) Type in your company name or the stock symbol (if you know it) in the search field at the top of the page. b) From the menu, choose "Financials" and click on "Annual". You will see 4 years of income statement, balance sheet, and cash flow data. c) For each financial statement date, find the historical stock price on the last day of the corresponding month. You will find the data under the menu "Historical Data". Use the closing stock price (not the adjusted close) and the "Basic Average Shares" on the income statement to calculate the firm's market capitalization at each date. d) For each of the four years, compute the following ratios. - Price-Earnings Ratio (for EPS use Diluted EPS) - Market-to-Book Ratio - Operating Margin - Net Profit Margin - Return on Equity - Return on Assets - Current Ratio - Interest Coverage Ratio (EBIT/Interest Expense) - Debt-Equity Ratio (market) - Debt-Equity Ratio (book) Q2. From your analysis of 4 years of data, what is your outlook of the firm you have chosen? * Present your results for Q1 in table format as shown below, followed by your answer to Q2. Any calculations or original data may be attached as a separate file or sheet to your main page
Step by Step Solution
There are 3 Steps involved in it

Get step-by-step solutions from verified subject matter experts