

Question: Please help me this question by using python!! 2 Scatter plots and histograms pioieser in p 1. Create random points drawn from a bivariate normal
Please help me this question by using python!!
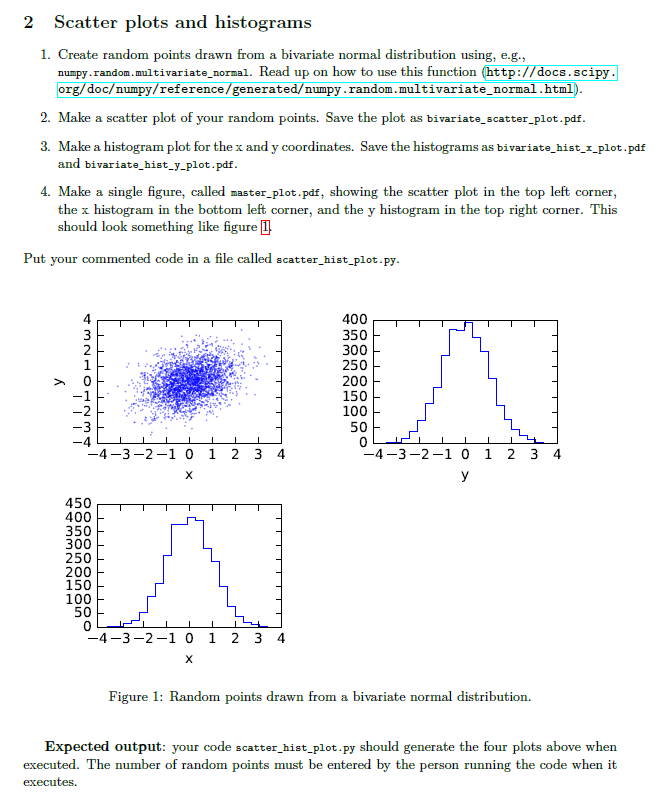
2 Scatter plots and histograms pioieser in p 1. Create random points drawn from a bivariate normal distribution using, e.g, numpy.random.multivariate_ normal. Read up on how to use this function (http://doc org/documpy/reference/generatedumpy. random.multivariate normal.html) s.SCi 2. Make a scatter plot of your random points. Save the plot as bivariate_scatter plot.pd:f 3. Make a histogram plot for thex and y coordinates. Save the histograms as bivariate_hist_x_plot.pdf 4. Make a single figure, called master_plot.pdf, showing the scatter plot in the top left corner, and bivariate_hist_y_plot.pdf the x histogram in the bottom left corner, and the y histogram in the top right corner. This should look something like figure 1 Put your commen ted code in a file called scatter_hist_plot.py 400 350 300 250 200 150 100 50 4 2 2 4 -4-3-2-1 0 1 2 3 4 -4-3-2-1 0 1 2 3 4 450 400 350 300 250 200 150 100 50 0 -4-3-2-1 0 1 2 3 4 Figure 1: Random points drawn from a bivariate normal distribution. Expected output: your code scatter_hist_plot.py should generate the four plots above when executed. The number of random points must be entered by the person running the code when it executes
Step by Step Solution
There are 3 Steps involved in it

Get step-by-step solutions from verified subject matter experts