

Question: Please help me through this problem, having a lot of trouble. The scatter plot below depicts the height and shoe size of 60 female students
Please help me through this problem, having a lot of trouble.
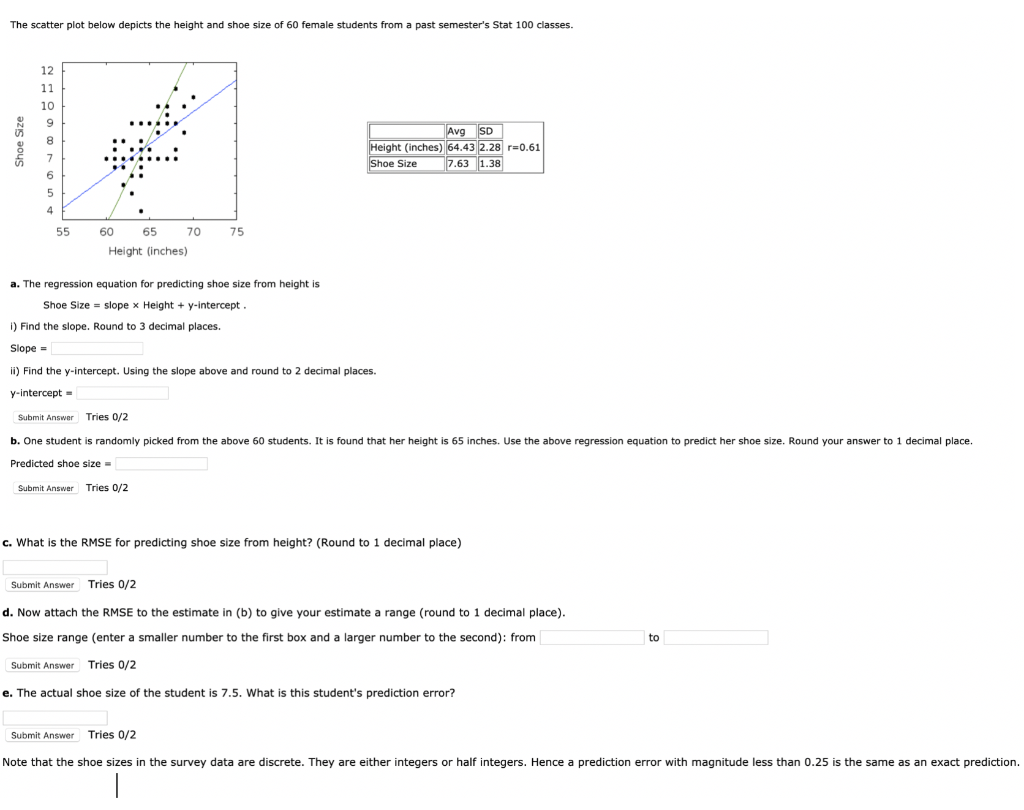
The scatter plot below depicts the height and shoe size of 60 female students from a past semester's Stat 100 classes. 12 10 Shoe Size Avg SD Height (inches) 64.43 2.28 r=0.61 Shoe Size 7.63 1.38 55 60 65 70 75 Height (inches) a. The regression equation for predicting shoe size from height is Shoe Size = slope x Height + y-intercept . 1) Find the slope. Round to 3 decimal places. Slope = ii) Find the y-intercept. Using the slope above and round to 2 decimal places. y-intercept = Submit Answer | Tries 0/2 b. One student is randomly picked from the above 60 students. It is found that her height is 65 inches. Use the above regression equation to predict her shoe size. Round your answer to 1 decimal place. Predicted shoe size = Submit Answer | Tries 0/2 c. What is the RMSE for predicting shoe size from height? (Round to 1 decimal place) Submit Answer Tries 0/2 d. Now attach the RMSE to the estimate in (b) to give your estimate a range (round to 1 decimal place). Shoe size range (enter a smaller number to the first box and a larger number to the second): from to Submit Answer Tries 0/2 e. The actual shoe size of the student is 7.5. What is this student's prediction error? Submit Answer Tries 0/2 Note that the shoe sizes in the survey data are discrete. They are either integers or half integers. Hence a prediction error with magnitude less than 0.25 is the same as an exact prediction
Step by Step Solution
There are 3 Steps involved in it

Get step-by-step solutions from verified subject matter experts