Question: PLEASE HELP ME TO ANSWER REQUIREMENT C ONLY. WITH SOLUTIONS THANK YOU . Information for balance sheet A. FINANCIAL STATEMENT ANALYSIS December 31 Balance Sheet
PLEASE HELP ME TO ANSWER REQUIREMENT "C" ONLY. WITH SOLUTIONS THANK YOU . Information for balance sheet
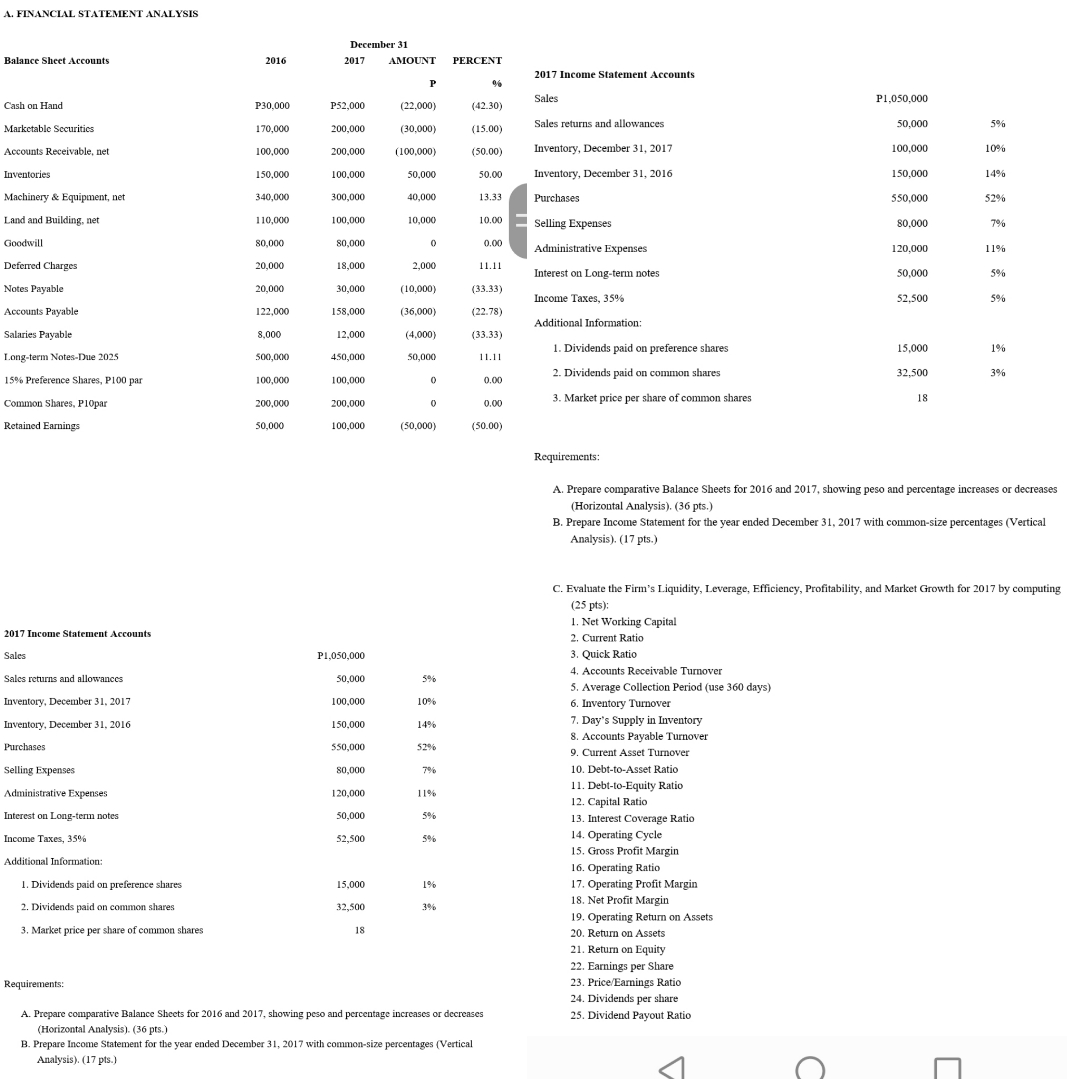
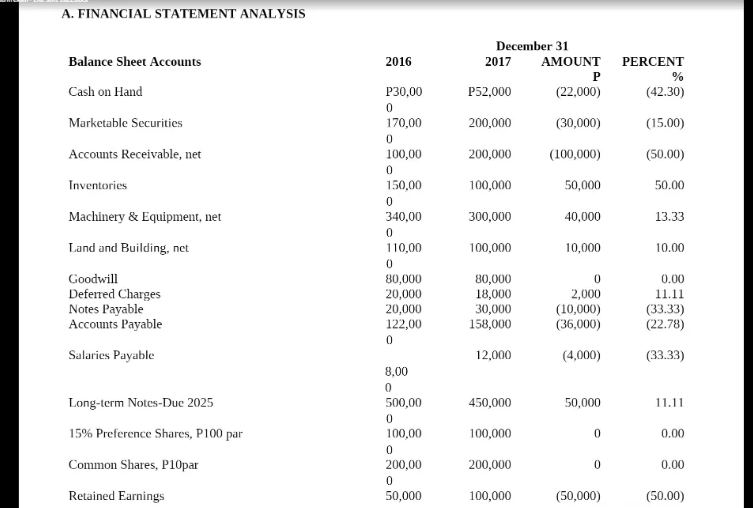
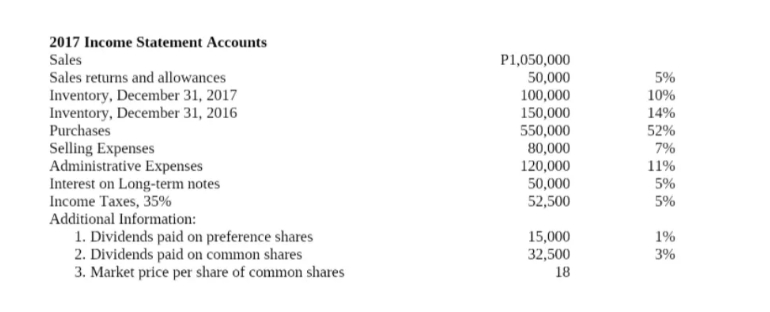
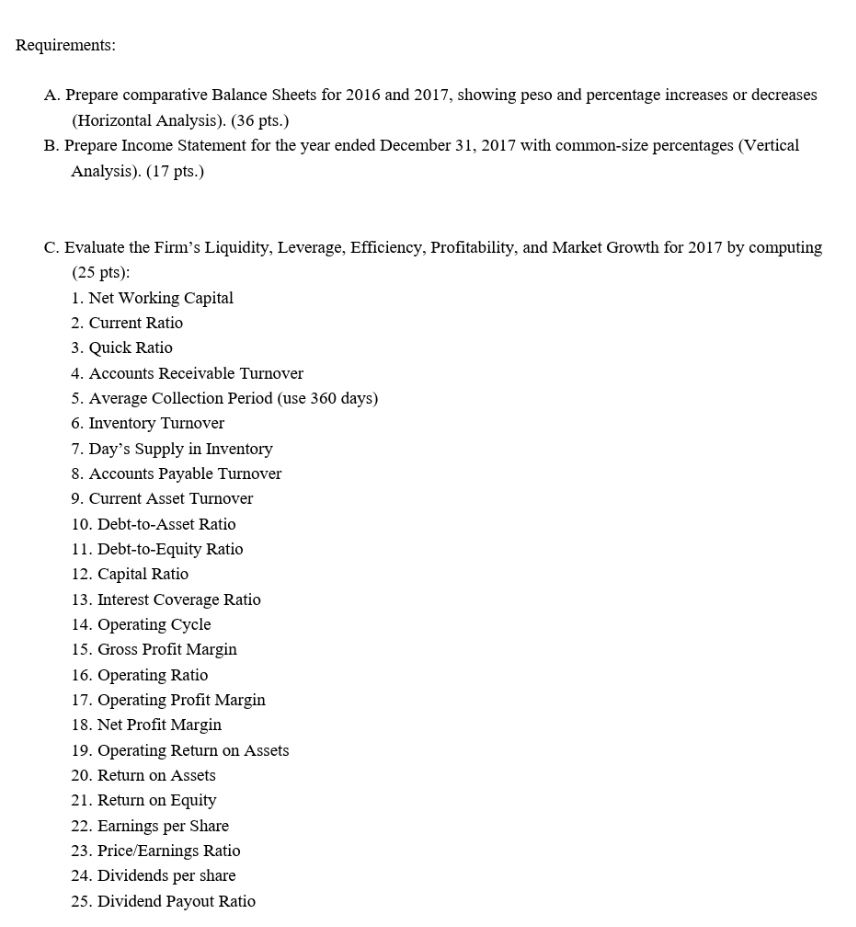
A. FINANCIAL STATEMENT ANALYSIS December 31 Balance Sheet Accounts 2016 2017 AMOUNT PERCENT 2017 Income Statement Accounts Cash on Hand P30,000 P52,000 (22,000) 42.30 Sales P1,050,000 Marketable Securities 170,000 200,000 (30,000 (15.00) Sales returns and allowances 50,000 5% Accounts Receivable, net 100,000 200.000 (100,000) (50.00) inventory, December 31, 2017 100,000 10% niventories 150,000 100,000 50,000 50.00 Inventory, December 31, 2016 150,000 14% Machinery & Equipment, net 340,000 300,000 40,000 13.33 Purchases $50,000 $2% Land and Building, net 1 10,000 100,000 10,000 10.00 Selling Expenses 80,000 7% Goodwil 80,000 30,000 0.00 Administrative Expenses 120,000 11% Deferred Charges 20,00 18,000 2,000 11.11 Interest on Long-term notes 50,000 5% Notes Payable 20,000 30,000 10,000) (33.33) income Taxes, 35% 52,500 5% Accounts Payable 122,000 158,00 36,000) (22.78 Additional Information: Salaries Payable 8,000 12,000 4,000) (33.33) Long-term Notes-Due 2025 500,000 450,000 1. Dividends paid on preference shares 15,000 1% 50,000 11.1 2. Dividends paid on common shares 32,500 3% 15% Preference Shares, P100 par 100,000 100,000 0.00 200,000 0,00 3. Market price per share of common shares 18 Common Shares, Plopar 200.000 Retained Earnings 50,000 100,000 (50,000) (50.00 Requirements: A. Prepare comparative Balance Sheets for 2016 and 2017, showing peso and percentage increases or decreases (Horizontal Analysis). (36 pts.) B. Prepare Income Statement for the year ended December 31, 2017 with common-size percentages (Vertical Analysis). (17 pts.) C. Evaluate the Firm's Liquidity, Leverage, Efficiency, Profitability, and Market Growth for 2017 by computing (25 pts): 1. Net Working Capital 2017 Income Statement Accounts 2. Current Ratio Sales P1,050,000 3. Quick Ratio Sales returns and allowances 50,000 4. Accounts Receivable Turnover 5% 5. Average Collection Period (use 360 days) Inventory, December 31. 2017 00.000 10% 6. Inventory Turnover Inventory, December 31. 2016 50,000 14% 7. Day's Supply in Inventory 3. Accounts Payable Turnover Purchases $50,000 $29% 9. Current Asset Turnover Selling Expenses 80,000 79% 10. Debt-to-Asset Ratio Administrative Expenses 120,000 1 1% 1 1. Debt-to-Equity Ratio 12. Capital Ratio Interest on Long-term notes 50,000 5% 13. Interest Coverage Ratio Income Taxes, 35% $2,500 14. Operating Cycle 15. Gross Profit Margin Additional Information: 16. Operating Ratio 1. Dividends paid on preference shares 15,000 1% 17. Operating Profit Margin 2. Dividends paid on common shares 32,50 18. Net Profit Margin 19. Operating Return on Assets 3. Market price per share of common shares 18 20. Return on Assets 21. Return on Equity 22. Earnings per Share Requirements: 23. Price/Earnings Ratio 24. Dividends per share A. Prepare comparative Balance Sheets for 2016 and 2017, showing peso and percentage increases or decreases 25. Dividend Payout Ratio (Horizontal Analysis). (36 pts.) B. Prepare Income Statement for the year ended December 31, 2017 with common-size percentages (Vertical Analysis). (17 pts.)A. FINANCIAL STATEMENT ANALYSIS December 31 Balance Sheet Accounts 2016 2017 AMOUNT PERCENT P % Cash on Hand P30,00 P52,000 (22,000) (42.30) 0 Marketable Securities 170,00 200,000 (30,000) (15.00) Accounts Receivable, net 100,00 200,000 (100,000) (50.00) Inventories 150.00 100,000 50,000 50.00 0 Machinery & Equipment, net 340,00 300,000 40,000 13.33 0 Land and Building, net 110.00 100,000 10,000 10.00 0 Goodwill 80,000 80,000 0.00 Deferred Charges 20,000 18,000 2,000 11.11 Notes Payable 20,000 30,000 (10,000) Accounts Payable (33.33) 122,00 158,000 (36,000) (22.78) 0 Salaries Payable 12,000 (4,000) (33.33) 8.00 0 Long-term Notes-Due 2025 500,00 450,000 50,000 11.11 0 15% Preference Shares, P100 par 100,00 100,000 0 0.00 0 Common Shares, P10par 200,00 200,000 0.00 0 Retained Earnings 50,000 100,000 (50,000) (50.00)2017 Income Statement Accounts Sales P1,050,000 Sales returns and allowances 50,000 5% Inventory, December 31, 2017 100,000 10% Inventory, December 31, 2016 150,000 14% Purchases 550,000 52% Selling Expenses 80,000 7% Administrative Expenses 120,000 11% Interest on Long-term notes 50,000 5% Income Taxes, 35% 52,500 5% Additional Information: 1. Dividends paid on preference shares 15,000 1% 2. Dividends paid on common shares 32,500 3% 3. Market price per share of common shares 18Requirements: A. Prepare comparative Balance Sheets for 2016 and 2017, showing peso and percentage increases or decreases (Horizontal Analysis). (36 pts.) B. Prepare Income Statement for the year ended December 31, 2017 with common-size percentages (Vertical Analysis). (17 pts.) C. Evaluate the Firm's Liquidity, Leverage, Efficiency, Profitability, and Market Growth for 2017 by computing (25 pts): 1. Net Working Capital 2. Current Ratio 3. Quick Ratio 4. Accounts Receivable Turnover 5. Average Collection Period (use 360 days) 6. Inventory Turnover 7. Day's Supply in Inventory 8. Accounts Payable Turnover 9. Current Asset Turnover 10. Debt-to-Asset Ratio 11. Debt-to-Equity Ratio 12. Capital Ratio 13. Interest Coverage Ratio 14. Operating Cycle 15. Gross Profit Margin 16. Operating Ratio 17. Operating Profit Margin 18. Net Profit Margin 19. Operating Return on Assets 20. Return on Assets 21. Return on Equity 22. Earnings per Share 23. Price/Earnings Ratio 24. Dividends per share 25. Dividend Payout Ratio