

Question: Please help me to identify the items on the IS like the example for the forecast. Like Revenue = sales Example: 2021 79 63 31-Mar-2021
Please help me to identify the items on the IS like the example for the forecast. Like Revenue = sales
Example:
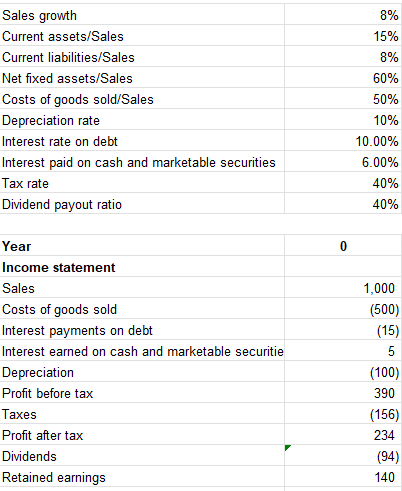
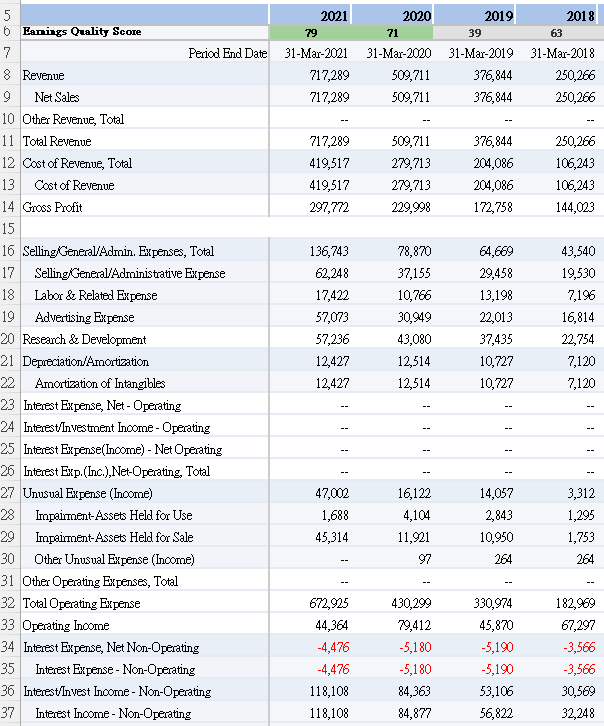
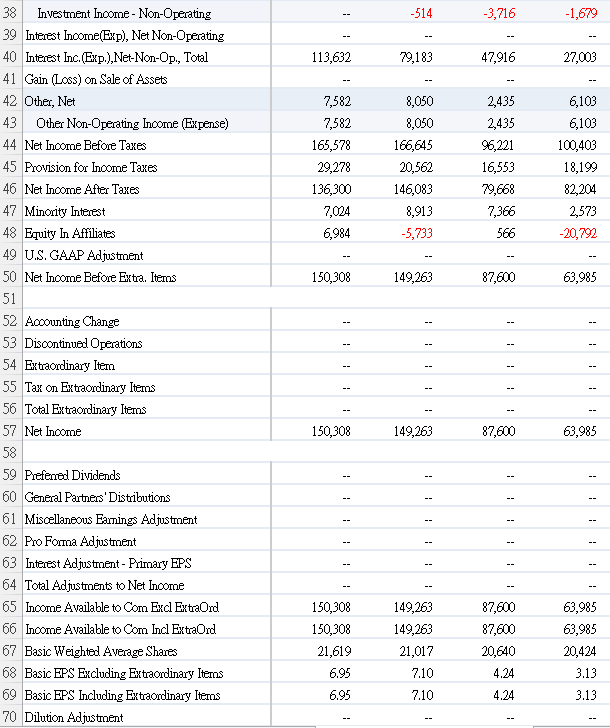
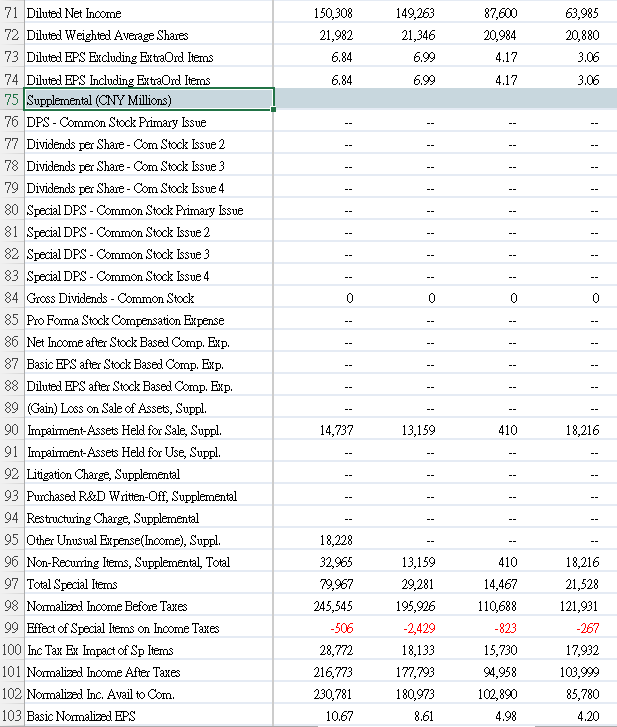
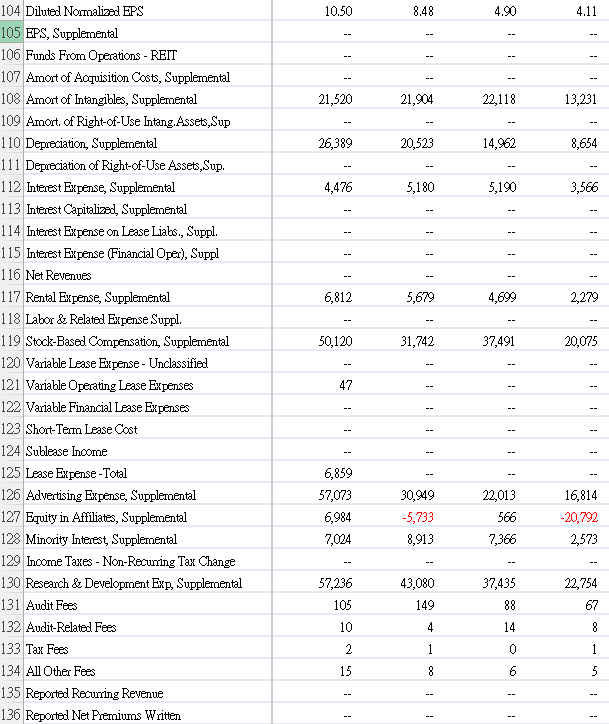
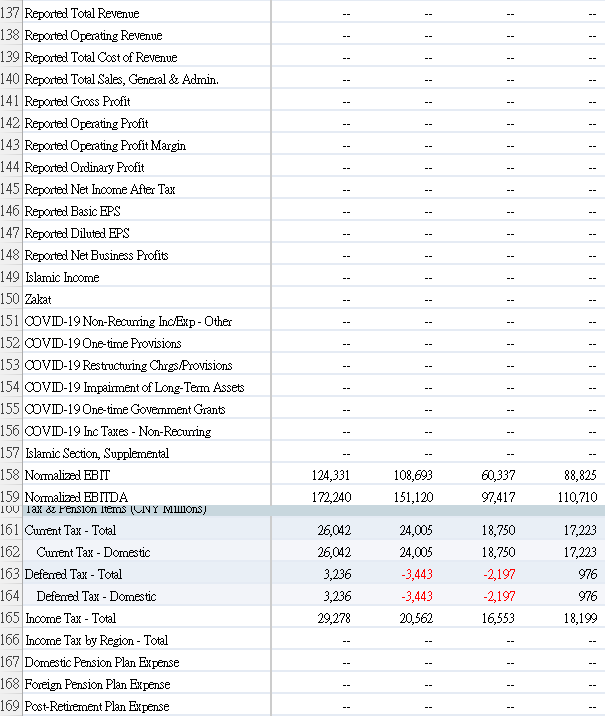
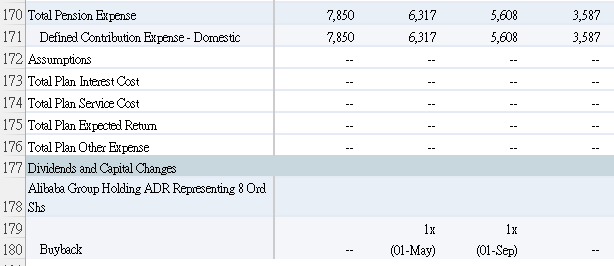
2021 79 63 31-Mar-2021 717,289 717,289 2020 2019 2018 71 39 31-Mar-2020 31-Mar-2019 31-Mar-2018 509,711 376,844 250,266 509,711 376,844 250,266 717,289 419,517 419,517 297,772 509,711 279,713 279,713 229,998 376,844 204,086 204,086 172,758 250,266 106,243 106,243 144,023 5 6 Eanings Quality Score 7 Period End Date 8 Revenue 9 Net Sales 10 Other Revenue, Total 11 Total Revenue 12 Cost of Revenue, Total 13 Cost of Revenue 14 Gross Profit 15 16 Selling/General/Admin. Expenses, Total 17 Selling General/Administrative Expense 18 Labor & Related Expense 19 Advertising Expense 20 Research & Development 21 Depreciation/Amortization 22 Amortization of Intangibles 23 Interest Expense, Net - Operating 24 Interest/Investment Income - Operating 25 Interest Expense(Income) - Net Operating 26 Interest Exp. (Inc.), Net-Operating, Total 27 Unusual Expense (Income) 28 Impairment-Assets Held for Use 29 Impairment-Assets Held for Sale 30 Other Unusual Expense (Income) 31 Other Operating Expenses, Total 32 Total Operating Expense 33 Operating Income 34 Interest Expense, Net Non-Operating 35 Interest Expense - Non-Operating 36 Interest Invest Income - Non-Operating 37 Interest Income - Non-Operating 136,743 62,248 17,422 57,073 57,236 12,427 12,427 78,870 37,155 10,766 30,949 43,080 12,514 12,514 64,669 29,458 13,198 22,013 37,435 10,727 10,727 43,540 19,530 7,196 16,814 22,754 7,120 7,120 -- 47,002 1,688 45,314 16,122 4,104 11,921 97 14,057 2,843 10,950 3,312 1,295 1,753 264 264 672,925 44,364 -4,476 -4,476 118,108 118,108 430,299 79,412 -5,180 -5,180 84,363 84,877 330,974 45,870 -5,190 -5,190 53,106 56,822 182,969 67,297 -3,566 -3,566 30,569 32,248 -- -514 -3,716 -1,679 113,632 79,183 47,916 27,003 7,582 7,582 165,578 29,278 136,300 7,024 6,984 8,050 8,050 166,645 20,562 146,083 8,913 -5,733 2,435 2,435 6,221 16,553 79,668 7,366 566 6,103 6,103 100,403 18,199 82,204 2,573 -20,792 150,308 149,263 87,600 63,985 -- 38 Investment Income - Non-Operating 39 Interest Income(Exp), Net Non-Operating 40 Interest Inc.(Exp.), Net-Non-Op., Total 41 Gain (Loss) on Sale of Assets 42 Other, Net 43 Other Non-Operating Income (Expense) 44 Net Income Before Taxes 45 Provision for Income Taxes 46 Net Income After Taxes 47 Minority Interest 48 Equity In Affiliates 49 U.S. GAAP Adjustment 50 Net Income Before Extra. Itemos 51 52 Accounting Change 53 Discontinued Operations 54 Extraordinary Item 55 Tax on Extraordinary Items 56 Total Extraordinary Itemos 57 Net Income 58 59 Preferred Dividends 60 General Partners Distributions 61 Miscellaneous Earnings Adjustment 62 Pro Forma Adjustment 63 Interest Adjustment - Primary EPS 64 Total Adjustments to Net Income 65 Income Available to Com Excl Extraord 66 Income Available to Com Incl Extraord 67 Basic Weighted Average Shares 68 Basic EPS Excluding Extraordinary Items 69 Basic EPS Including Extraordinary Items 70 Dilution Adjustment -- -- -- -- -- 150,308 149,263 87,600 63,985 -- -- -- -- -- -- -- -- -- -- -- 150,308 150,308 21,619 6.95 6.95 149,263 149,263 21,017 7.10 7.10 87,600 87,600 20,640 4.24 63,985 63,985 20,424 3.13 3.13 4.24 150,308 21,982 6.84 6.84 149,263 21,346 6.99 87,600 20,984 4.17 63,985 20,880 3.06 3.06 6.99 4.17 -- -- -- -- -- -- -- -- -- -- 0 71 Diluted Net Income 72 Diluted Weighted Average Shares 73 Diluted EPS Excluding Extraord Iterns 74 Diluted EPS Including Extraord Items 75 Supplemental (CNY Millions) 76 DPS - Common Stock Primary Issue 77 Dividends per Share - Com Stock Issue 2 78 Dividends per Share - Com Stock Issue 3 79 Dividends per Share - Com Stock Issue 4 80 Special DPS - Common Stock Primary Issue 81 Special DPS - Common Stock Issue 2 82 Special DPS - Common Stock Issue 3 83 Special DPS - Common Stock Issue 4 84 Gross Dividends - Common Stock 85 Pro Forma Stock Compensation Expense 86 Net Income after Stock Based Comp. Exp. 87 Basic EPS after Stock Based Comp. Exp. 88 Diluted EPS after Stock Based Comp. Exp. 89 (Gain) Loss on Sale of Assets, Suppl. 90 Impairment-Assets Held for Sale, Suppl. 91 Impairment-Assets Held for Use, Suppl. 92 Litigation Charge, Supplemental 93 Purchased R&D Written-Off, Supplemental 94 Restructuring Charge, Supplemental 95 Other Unusual Expense(Income), Suppl. 96 Non-Recurring Items, Supplemental. Total 97 Total Special Items 98 Normalized Income Before Taxes 99 Effect of Special Items on Income Taxes 100 Inc Tax Ex Impact of Sp Items 101 Nomalized Income After Taxes 102 Normalized Inc. Avail to Com. 103 Basic Normalized EPS -- -- -- -- -- 14,737 13,159 410 18,216 -- -- i -- -- -- -- -- -- 18,228 32,965 79,967 245,545 -506 28,772 216,773 230,781 10.67 13,159 29,281 195,926 -2,429 18,133 177,793 180,973 8.61 410 14,467 110,688 -823 15,730 94,958 102,890 4.98 18,216 21,528 121,931 -267 17,932 103,999 85,780 4.20 10.50 8.48 4.90 4.11 -- -- 21,520 21,904 22,118 13,231 26,389 20,523 14,962 8,654 4,476 5,180 5,190 3,566 -- -- - -- -- 6,812 5,679 4,699 2,279 50,120 31,742 37,491 20,075 104 Diluted Normalized EPS 105 EPS, Supplemental 106 Funds From Operations - REIT 107 Amort of Acquisition Costs, Supplemental 108 Amort of Intangibles, Supplemental 109 Amort of Right-of-Use Intang. Assets, Sup 110 Depreciation, Supplemental 111 Depreciation of Right-of-Use Assets, Sup. 112 Interest Expense, Supplemental 113 Interest Capitalized, Supplemental 114 Interest Expense on Lease Lials., Suppl. 115 Interest Expense (Financial Oper), Suppl 116 Net Revenues 117 Rental Expense, Supplemental 118 Labor & Related Expense Suppl. 119 Stock-Based Compensation, Supplemental 120 Variable Lease Expense - Unclassified 121 Variable Operating Lease Expenses 122 Variable Financial Lease Expenses 123 Short-Term Lease Cost 124 Sublease Income 125 Lease Expense - Total 126 Advertising Expense, Supplemental 127 Equity in Affiliates, Supplemental 128 Minority Interest Supplemental 129 Income Taxes - Non-Recurring Tax Change 130 Research & Development Exp. Supplemental 131 Audit Fees 132 Audit-Related Fees 133 Tax Fees 134 All Other Fees 135 Reported Recurring Revenue 136 Reported Net Premiums Written -- - 47 -- -- -- -- -- - 6,859 57,073 6,984 7,024 30,949 -5,733 8,913 22,013 566 7,366 16,814 -20,792 2,573 - 57,236 105 10 43,080 149 4 37,435 88 22,754 67 14 8 2 1 0 1 15 8 vo 5 -- -- -- -- -- - -- -- -- -- -- -- -- -- i -- -- -- -- -- -- -- 137 Reported Total Revenue 138 Reported Operating Revenue 139 Reported Total Cost of Revenue 140 Reported Total Sales, General & Admin. 141 Reported Gross Profit 142 Reported Operating Profit 143 Reported Operating Profit Margin 144 Reported Ordinary Profit 145 Reported Net Income After Tax 146 Reported Basic EPS 147 Reported Diluted EPS 148 Reported Net Business Profits 149 Islamic Income 150 Zakat 151 OVID-19 Non-Recurring Inc/Exp-Other 152 VD-19One-time Provisions 153 OOVID-19 Restructuring Chrys/Provisions 154 VD-19 Impairment of Long-Term Assets 155 OOVID-19 One-time Government Grants 156 OOVID-19 Inc Taxes - Non-Recurring 157 Islamic Section, Supplemental 158 Normalized EBIT 159 Normalized EBITDA IOU Tax & Pension Items (CNY MWONS) 161 Current Tax - Total 162 Current Tax - Domestic 163 Defenced Tax - Total 164 Deferred Tax - Domestic 165 Income Tax - Total 166 Income Tax by Region - Total 167 Domestic Pension Plan Expense 168 Foreign Pension Plan Expense 169 Post-Retirement Plan Expense -- -- -- -- -- -- -- 124,331 172,240 108,693 151,120 60,337 97,417 88,825 110,710 - 26,042 26,042 3,236 3,236 29,278 24,005 24,005 -3,443 -3,443 20,562 18,750 18,750 -2,197 -2,197 16,553 17,223 17,223 976 976 18,199 -- -- 7,850 7,850 6,317 6,317 5,608 5,608 3,587 3,587 -- - -- 170 Total Pension Expense 171 Defined Contribution Expense - Domestic 172 Assumptions 173 Total Plan Interest Cost 174 Total Plan Service Cost 175 Total Plan Expected Return 176 Total Plan Other Expense 177 Dividends and Capital Changes Alibaba Group Holding ADR Representing 8 Ord 178 Shs 179 180 Buyback -- -- -- -- -- 1x 1x (01-Sep) (01-May) Sales growth Current assets/Sales Current liabilities/Sales Net fixed assets/Sales Costs of goods sold/Sales Depreciation rate Interest rate on debt Interest paid on cash and marketable securities Tax rate Dividend payout ratio 8% 15% 8% 60% 50% 10% 10.00% 6.00% 40% 40% 0 Year Income statement Sales Costs of goods sold Interest payments on debt Interest earned on cash and marketable securitie Depreciation Profit before tax Taxes Profit after tax Dividends Retained earnings 1,000 (500) (15) 5 (100) 390 (156) 234 (94) 140 2021 79 63 31-Mar-2021 717,289 717,289 2020 2019 2018 71 39 31-Mar-2020 31-Mar-2019 31-Mar-2018 509,711 376,844 250,266 509,711 376,844 250,266 717,289 419,517 419,517 297,772 509,711 279,713 279,713 229,998 376,844 204,086 204,086 172,758 250,266 106,243 106,243 144,023 5 6 Eanings Quality Score 7 Period End Date 8 Revenue 9 Net Sales 10 Other Revenue, Total 11 Total Revenue 12 Cost of Revenue, Total 13 Cost of Revenue 14 Gross Profit 15 16 Selling/General/Admin. Expenses, Total 17 Selling General/Administrative Expense 18 Labor & Related Expense 19 Advertising Expense 20 Research & Development 21 Depreciation/Amortization 22 Amortization of Intangibles 23 Interest Expense, Net - Operating 24 Interest/Investment Income - Operating 25 Interest Expense(Income) - Net Operating 26 Interest Exp. (Inc.), Net-Operating, Total 27 Unusual Expense (Income) 28 Impairment-Assets Held for Use 29 Impairment-Assets Held for Sale 30 Other Unusual Expense (Income) 31 Other Operating Expenses, Total 32 Total Operating Expense 33 Operating Income 34 Interest Expense, Net Non-Operating 35 Interest Expense - Non-Operating 36 Interest Invest Income - Non-Operating 37 Interest Income - Non-Operating 136,743 62,248 17,422 57,073 57,236 12,427 12,427 78,870 37,155 10,766 30,949 43,080 12,514 12,514 64,669 29,458 13,198 22,013 37,435 10,727 10,727 43,540 19,530 7,196 16,814 22,754 7,120 7,120 -- 47,002 1,688 45,314 16,122 4,104 11,921 97 14,057 2,843 10,950 3,312 1,295 1,753 264 264 672,925 44,364 -4,476 -4,476 118,108 118,108 430,299 79,412 -5,180 -5,180 84,363 84,877 330,974 45,870 -5,190 -5,190 53,106 56,822 182,969 67,297 -3,566 -3,566 30,569 32,248 -- -514 -3,716 -1,679 113,632 79,183 47,916 27,003 7,582 7,582 165,578 29,278 136,300 7,024 6,984 8,050 8,050 166,645 20,562 146,083 8,913 -5,733 2,435 2,435 6,221 16,553 79,668 7,366 566 6,103 6,103 100,403 18,199 82,204 2,573 -20,792 150,308 149,263 87,600 63,985 -- 38 Investment Income - Non-Operating 39 Interest Income(Exp), Net Non-Operating 40 Interest Inc.(Exp.), Net-Non-Op., Total 41 Gain (Loss) on Sale of Assets 42 Other, Net 43 Other Non-Operating Income (Expense) 44 Net Income Before Taxes 45 Provision for Income Taxes 46 Net Income After Taxes 47 Minority Interest 48 Equity In Affiliates 49 U.S. GAAP Adjustment 50 Net Income Before Extra. Itemos 51 52 Accounting Change 53 Discontinued Operations 54 Extraordinary Item 55 Tax on Extraordinary Items 56 Total Extraordinary Itemos 57 Net Income 58 59 Preferred Dividends 60 General Partners Distributions 61 Miscellaneous Earnings Adjustment 62 Pro Forma Adjustment 63 Interest Adjustment - Primary EPS 64 Total Adjustments to Net Income 65 Income Available to Com Excl Extraord 66 Income Available to Com Incl Extraord 67 Basic Weighted Average Shares 68 Basic EPS Excluding Extraordinary Items 69 Basic EPS Including Extraordinary Items 70 Dilution Adjustment -- -- -- -- -- 150,308 149,263 87,600 63,985 -- -- -- -- -- -- -- -- -- -- -- 150,308 150,308 21,619 6.95 6.95 149,263 149,263 21,017 7.10 7.10 87,600 87,600 20,640 4.24 63,985 63,985 20,424 3.13 3.13 4.24 150,308 21,982 6.84 6.84 149,263 21,346 6.99 87,600 20,984 4.17 63,985 20,880 3.06 3.06 6.99 4.17 -- -- -- -- -- -- -- -- -- -- 0 71 Diluted Net Income 72 Diluted Weighted Average Shares 73 Diluted EPS Excluding Extraord Iterns 74 Diluted EPS Including Extraord Items 75 Supplemental (CNY Millions) 76 DPS - Common Stock Primary Issue 77 Dividends per Share - Com Stock Issue 2 78 Dividends per Share - Com Stock Issue 3 79 Dividends per Share - Com Stock Issue 4 80 Special DPS - Common Stock Primary Issue 81 Special DPS - Common Stock Issue 2 82 Special DPS - Common Stock Issue 3 83 Special DPS - Common Stock Issue 4 84 Gross Dividends - Common Stock 85 Pro Forma Stock Compensation Expense 86 Net Income after Stock Based Comp. Exp. 87 Basic EPS after Stock Based Comp. Exp. 88 Diluted EPS after Stock Based Comp. Exp. 89 (Gain) Loss on Sale of Assets, Suppl. 90 Impairment-Assets Held for Sale, Suppl. 91 Impairment-Assets Held for Use, Suppl. 92 Litigation Charge, Supplemental 93 Purchased R&D Written-Off, Supplemental 94 Restructuring Charge, Supplemental 95 Other Unusual Expense(Income), Suppl. 96 Non-Recurring Items, Supplemental. Total 97 Total Special Items 98 Normalized Income Before Taxes 99 Effect of Special Items on Income Taxes 100 Inc Tax Ex Impact of Sp Items 101 Nomalized Income After Taxes 102 Normalized Inc. Avail to Com. 103 Basic Normalized EPS -- -- -- -- -- 14,737 13,159 410 18,216 -- -- i -- -- -- -- -- -- 18,228 32,965 79,967 245,545 -506 28,772 216,773 230,781 10.67 13,159 29,281 195,926 -2,429 18,133 177,793 180,973 8.61 410 14,467 110,688 -823 15,730 94,958 102,890 4.98 18,216 21,528 121,931 -267 17,932 103,999 85,780 4.20 10.50 8.48 4.90 4.11 -- -- 21,520 21,904 22,118 13,231 26,389 20,523 14,962 8,654 4,476 5,180 5,190 3,566 -- -- - -- -- 6,812 5,679 4,699 2,279 50,120 31,742 37,491 20,075 104 Diluted Normalized EPS 105 EPS, Supplemental 106 Funds From Operations - REIT 107 Amort of Acquisition Costs, Supplemental 108 Amort of Intangibles, Supplemental 109 Amort of Right-of-Use Intang. Assets, Sup 110 Depreciation, Supplemental 111 Depreciation of Right-of-Use Assets, Sup. 112 Interest Expense, Supplemental 113 Interest Capitalized, Supplemental 114 Interest Expense on Lease Lials., Suppl. 115 Interest Expense (Financial Oper), Suppl 116 Net Revenues 117 Rental Expense, Supplemental 118 Labor & Related Expense Suppl. 119 Stock-Based Compensation, Supplemental 120 Variable Lease Expense - Unclassified 121 Variable Operating Lease Expenses 122 Variable Financial Lease Expenses 123 Short-Term Lease Cost 124 Sublease Income 125 Lease Expense - Total 126 Advertising Expense, Supplemental 127 Equity in Affiliates, Supplemental 128 Minority Interest Supplemental 129 Income Taxes - Non-Recurring Tax Change 130 Research & Development Exp. Supplemental 131 Audit Fees 132 Audit-Related Fees 133 Tax Fees 134 All Other Fees 135 Reported Recurring Revenue 136 Reported Net Premiums Written -- - 47 -- -- -- -- -- - 6,859 57,073 6,984 7,024 30,949 -5,733 8,913 22,013 566 7,366 16,814 -20,792 2,573 - 57,236 105 10 43,080 149 4 37,435 88 22,754 67 14 8 2 1 0 1 15 8 vo 5 -- -- -- -- -- - -- -- -- -- -- -- -- -- i -- -- -- -- -- -- -- 137 Reported Total Revenue 138 Reported Operating Revenue 139 Reported Total Cost of Revenue 140 Reported Total Sales, General & Admin. 141 Reported Gross Profit 142 Reported Operating Profit 143 Reported Operating Profit Margin 144 Reported Ordinary Profit 145 Reported Net Income After Tax 146 Reported Basic EPS 147 Reported Diluted EPS 148 Reported Net Business Profits 149 Islamic Income 150 Zakat 151 OVID-19 Non-Recurring Inc/Exp-Other 152 VD-19One-time Provisions 153 OOVID-19 Restructuring Chrys/Provisions 154 VD-19 Impairment of Long-Term Assets 155 OOVID-19 One-time Government Grants 156 OOVID-19 Inc Taxes - Non-Recurring 157 Islamic Section, Supplemental 158 Normalized EBIT 159 Normalized EBITDA IOU Tax & Pension Items (CNY MWONS) 161 Current Tax - Total 162 Current Tax - Domestic 163 Defenced Tax - Total 164 Deferred Tax - Domestic 165 Income Tax - Total 166 Income Tax by Region - Total 167 Domestic Pension Plan Expense 168 Foreign Pension Plan Expense 169 Post-Retirement Plan Expense -- -- -- -- -- -- -- 124,331 172,240 108,693 151,120 60,337 97,417 88,825 110,710 - 26,042 26,042 3,236 3,236 29,278 24,005 24,005 -3,443 -3,443 20,562 18,750 18,750 -2,197 -2,197 16,553 17,223 17,223 976 976 18,199 -- -- 7,850 7,850 6,317 6,317 5,608 5,608 3,587 3,587 -- - -- 170 Total Pension Expense 171 Defined Contribution Expense - Domestic 172 Assumptions 173 Total Plan Interest Cost 174 Total Plan Service Cost 175 Total Plan Expected Return 176 Total Plan Other Expense 177 Dividends and Capital Changes Alibaba Group Holding ADR Representing 8 Ord 178 Shs 179 180 Buyback -- -- -- -- -- 1x 1x (01-Sep) (01-May) Sales growth Current assets/Sales Current liabilities/Sales Net fixed assets/Sales Costs of goods sold/Sales Depreciation rate Interest rate on debt Interest paid on cash and marketable securities Tax rate Dividend payout ratio 8% 15% 8% 60% 50% 10% 10.00% 6.00% 40% 40% 0 Year Income statement Sales Costs of goods sold Interest payments on debt Interest earned on cash and marketable securitie Depreciation Profit before tax Taxes Profit after tax Dividends Retained earnings 1,000 (500) (15) 5 (100) 390 (156) 234 (94) 140
Step by Step Solution
There are 3 Steps involved in it

Get step-by-step solutions from verified subject matter experts