

Question: Please help me to make a script for this: Explain the : scatter plot, data gathered, the conclusion and the importance of our output. (Use
Please help me to make a script for this:
Explain the : scatter plot, data gathered, the conclusion and the importance of our output. (Use word that easy to understand) I will give like if I will like the script
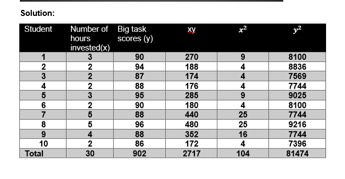
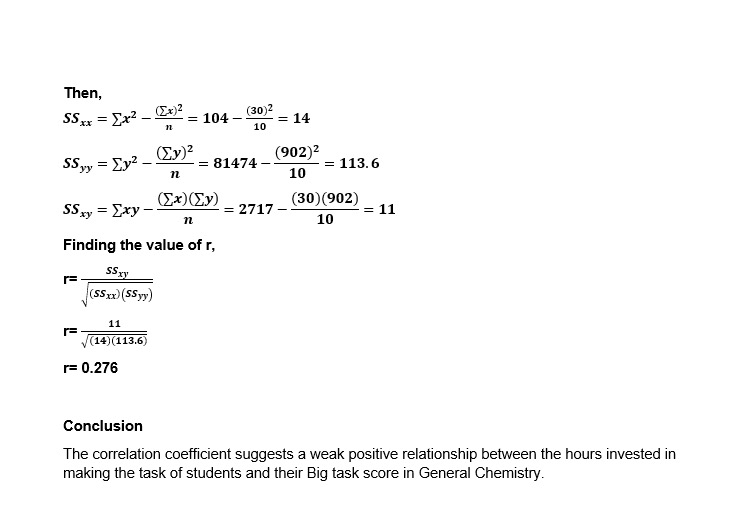
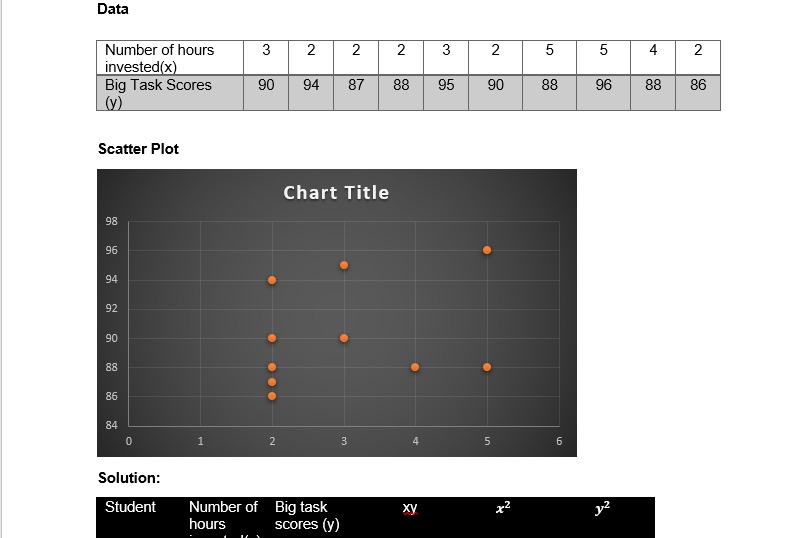
Solution: Student Number of Big task XY hours (y) invested(x) 90 270 8100 94 188 8536 87 174 7569 88 178 7744 95 205 9025 NLCONUNANG 90 180 8100 440 7744 96 400 25 9216 352 16 7744 10 86 172 4 7396 Total 902 104 81474Then, = 104 - (30)2 = 14 10 5Spy = Ey2 (902)2 = 81474 = 113.6 n 10 55 xy = Exy (30) (902) = 2717 =11 10 Finding the value of r, SS TV 1= (SS xx) (SSyy) 11 r= (14) (113.6) r= 0.276 Conclusion The correlation coefficient suggests a weak positive relationship between the hours invested in making the task of students and their Big task score in General Chemistry.Data Number of hours 3 2 2 2 3 2 5 5 4 2 invested(x) Big Task Scores 90 94 87 88 95 90 88 96 88 86 (y) Scatter Plot Chart Title 98 96 94 92 90 88 86 84 1 2 3 4 5 6 Solution: Student Number of Big task xy hours scores (y)
Step by Step Solution
There are 3 Steps involved in it

Get step-by-step solutions from verified subject matter experts