

Question: Please help me to solve the question. thanks This question is on Monetary Theory in the Long Run. The following graph shows the Annual CPI
Please help me to solve the question. thanks
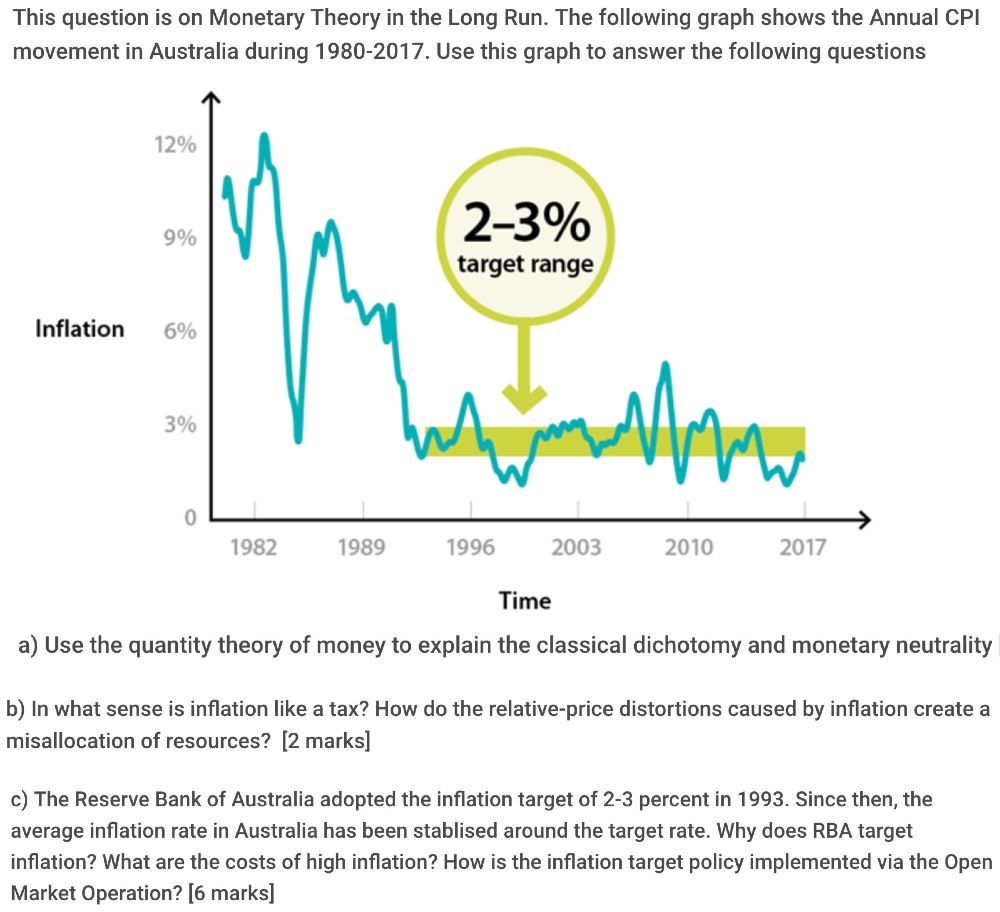
This question is on Monetary Theory in the Long Run. The following graph shows the Annual CPI movement in Australia during 1980-2017. Use this graph to answer the following questions 12% 9% 2-3% target range Inflation 6% 3% 0 1982 1989 1996 2003 2010 2017 Time a) Use the quantity theory of money to explain the classical dichotomy and monetary neutrality b) In what sense is inflation like a tax? How do the relative-price distortions caused by inflation create a misallocation of resources? [2 marks] c) The Reserve Bank of Australia adopted the inflation target of 2-3 percent in 1993. Since then, the average inflation rate in Australia has been stablised around the target rate. Why does RBA target inflation? What are the costs of high inflation? How is the inflation target policy implemented via the Open Market Operation? [6 marks]
Step by Step Solution
There are 3 Steps involved in it

Get step-by-step solutions from verified subject matter experts