

Question: Please help me to solve this coding homework using Python (jupiter notebook recomended) these are the data needed for the question AMD.csv DIS.csv VTI.csv ZM.csv
Please help me to solve this coding homework using Python (jupiter notebook recomended)
these are the data needed for the question
AMD.csv
DIS.csv
VTI.csv
ZM.csv
You can find this data on these google drive link (just copy and run the link)
https://drive.google.com/file/d/1bO5JnOH-ZBbc4m1o1Oj3UZo1rZyp4N8Y/view?usp=sharing
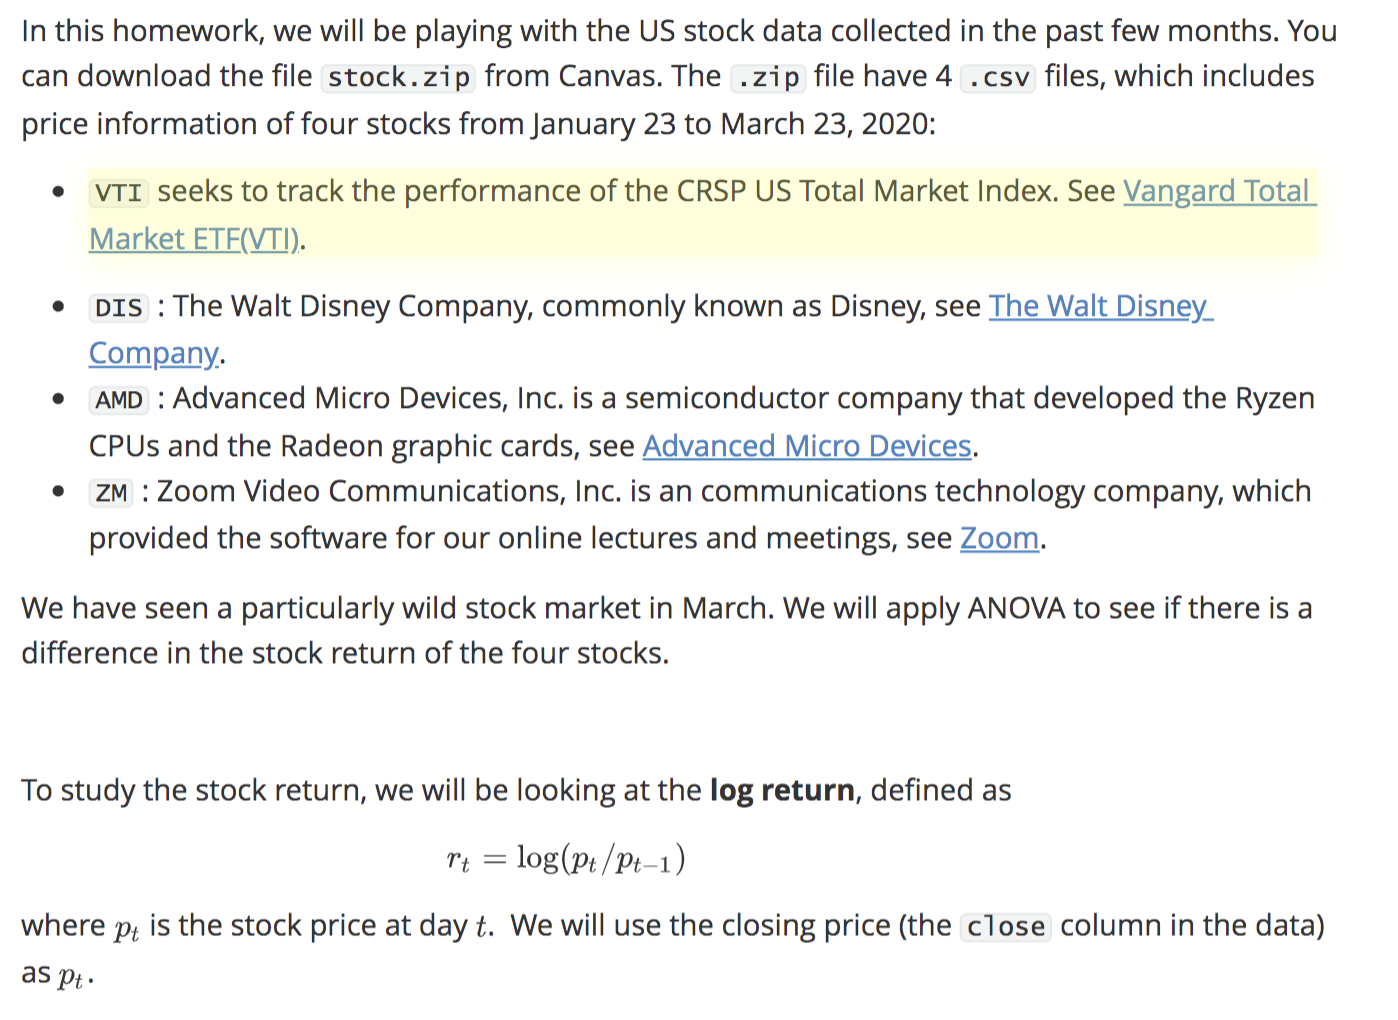
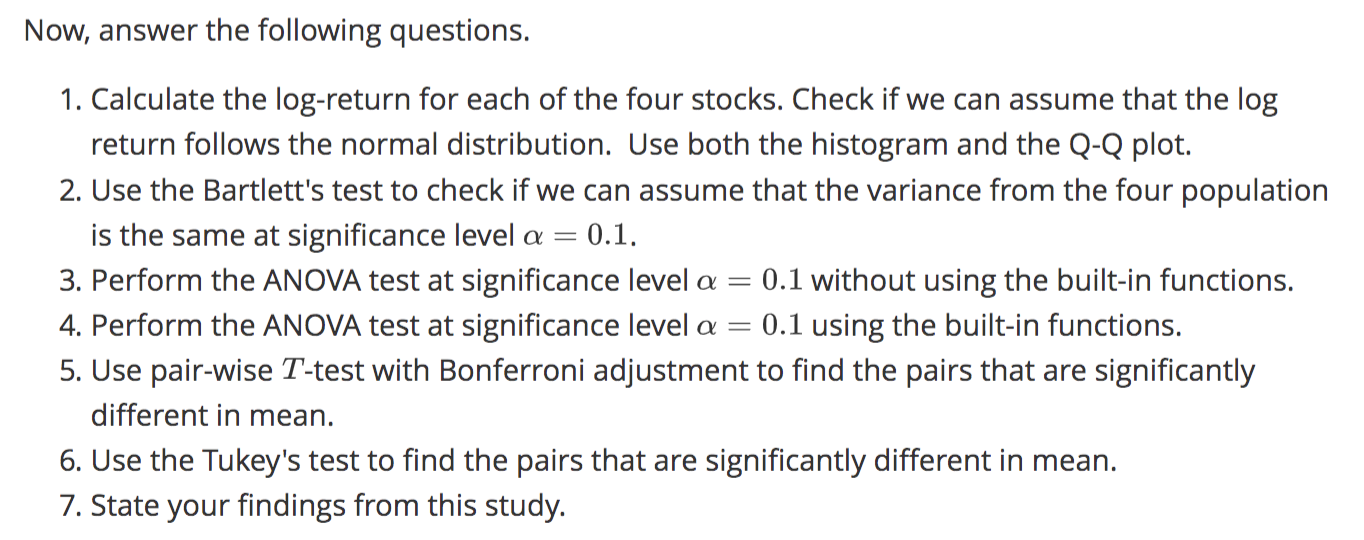
In this homework, we will be playing with the US stock data collected in the past few months. You can download the file stock.z1'p from Canvas. The .zip file have 4 .csv files, which includes price information of four stocks from January 23 to March 23, 2020: - VTI seeks to track the performance of the CRSP US Total Market Index. See mgard Total Market ETF(Vj),. 0 DIS : The Walt Disney Company, commonly known as Disney, see The Walt Disney_ Comtiy. 0 AMD : Advanced Micro Devices. Inc. is a semiconductor company that developed the Ryzen CPUs and the Radeon graphic cards, see Advanced Micro Devices. . ZM : Zoom Video Communications, Inc. is an communications technology company, which provided the software for our online lectures and meetings, see Zoom. We have seen a particularly wild stock market in March. We will apply ANOVA to see if there is a difference in the stock return of the four stocks. To study the stock return, we will be looking at the log return, defined as n = loam/pm) where pt is the stock price at day t. We will use the closing price (the dose column in the data) as Pt . Now, answer the following questions. 1. Calculate the log-return for each of the four stocks. Check if we can assume that the log return follows the normal distribution. Use both the histogram and the Q-Q plot. 2. Use the Bartlett's test to check if we can assume that the variance from the four population is the same at significance level a = 0.1. 3. Perform the ANOVA test at significance level a = 0.1 without using the built-in functions. 4. Perform the ANOVA test at significance level a = 0.1 using the built-in functions. 5. Use pair-wise T-test with Bonferroni adjustment to find the pairs that are significantly different in mean. 6. Use the Tukey's test to find the pairs that are significantly different in mean. 7. State your findings from this study
Step by Step Solution
There are 3 Steps involved in it

Get step-by-step solutions from verified subject matter experts