

Question: Please help me to solve this excel worksheet problem Please upload your answers as an excel file with properly labeled answers 9781284108217_WORK_Excel2007.pdf (SECURED) . Adobe
Please help me to solve this excel worksheet problem
Please upload your answers as an excel file with properly labeled answers
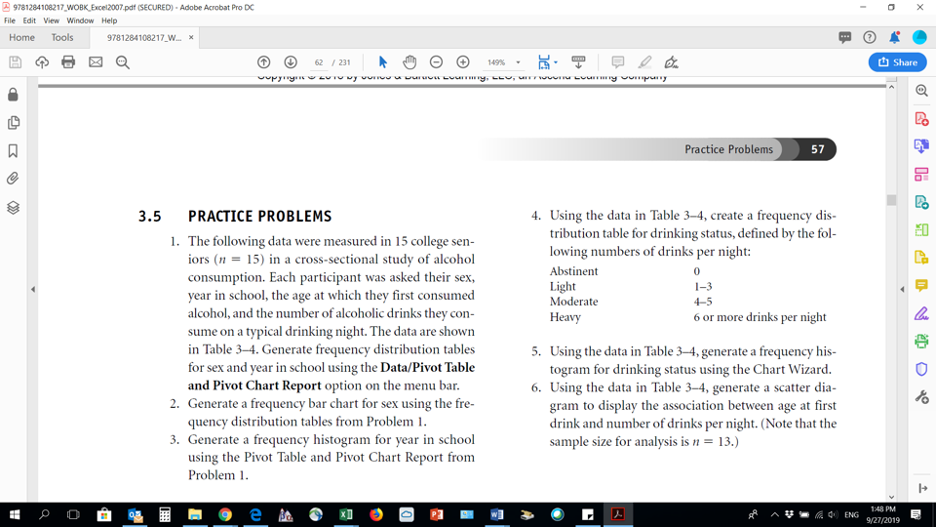
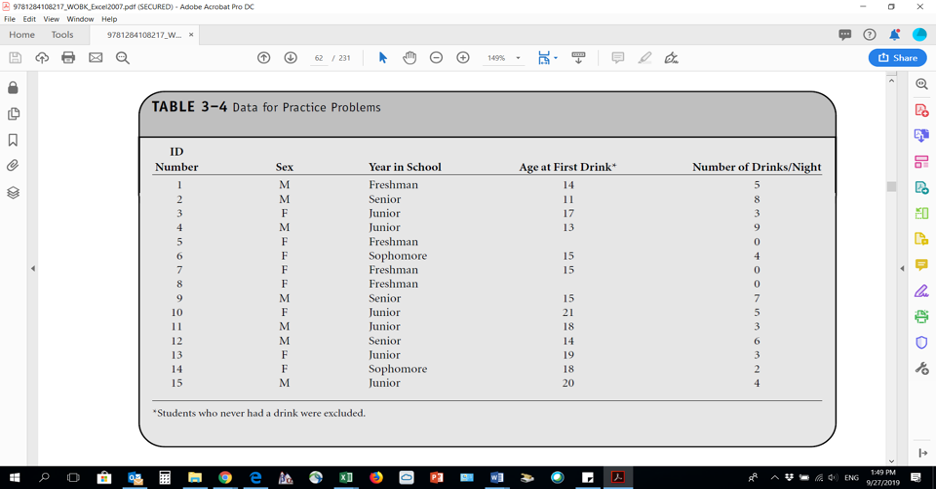
9781284108217_WORK_Excel2007.pdf (SECURED) . Adobe Acrobat Pro DC X File Edit View Window Help Home Tools 9781284108217_W_. x 62 / 231 14% . Share Practice Problems 57 3.5 PRACTICE PROBLEMS 4. Using the data in Table 3-4, create a frequency dis- 1. The following data were measured in 15 college sen- tribution table for drinking status, defined by the fol- iors (n = 15) in a cross-sectional study of alcohol lowing numbers of drinks per night: consumption. Each participant was asked their sex, Abstinent 0 Light 1-3 year in school, the age at which they first consumed Moderate 4-5 alcohol, and the number of alcoholic drinks they con- Heavy 6 or more drinks per night sume on a typical drinking night. The data are shown in Table 3-4. Generate frequency distribution tables 5. Using the data in Table 3-4, generate a frequency his- for sex and year in school using the Data/Pivot Table togram for drinking status using the Chart Wizard. and Pivot Chart Report option on the menu bar. 6. Using the data in Table 3-4, generate a scatter dia- 2. Generate a frequency bar chart for sex using the fre- to gram to display the association between age at first quency distribution tables from Problem 1. drink and number of drinks per night. (Note that the 3. Generate a frequency histogram for year in school sample size for analysis is n = 13.) using the Pivot Table and Pivot Chart Report from Problem 1. moe XI O Ed O F A VEM ENG 1:48 PM 9/27/201929781284108217_WORK_Excel2007-par (SECURED) . Adobe Acrobat Pro DC X File Edit View Window Help Home Tools 9781284108217_W_. * (7) 62 / 231 1-49% - Share TABLE 3-4 Data for Practice Problems A ID Number Sex Year in School Age at First Drink* Number of Drinks/Night M Freshman 14 M Senior 11 Junior 17 Junior 13 Freshman Sophomore 15 Freshman 15 ICEBOX YOUAWN- Freshman ANWOWWNOOROWOW Senior 15 Junior 21 Junior 18 Senior 14 Junior 19 Sophomore 18 15 Junior 20 "Students who never had a drink were excluded. O F AUDAC ENG 1649 PM 9 e Ed 0/27/2019
Step by Step Solution
There are 3 Steps involved in it

Get step-by-step solutions from verified subject matter experts