

Question: Please help me to solve this problem cross lectured - Higher or lower Time Series - Increase or Decrease Activity 2.1 Financial Ratios Presented below

Please help me to solve this problem
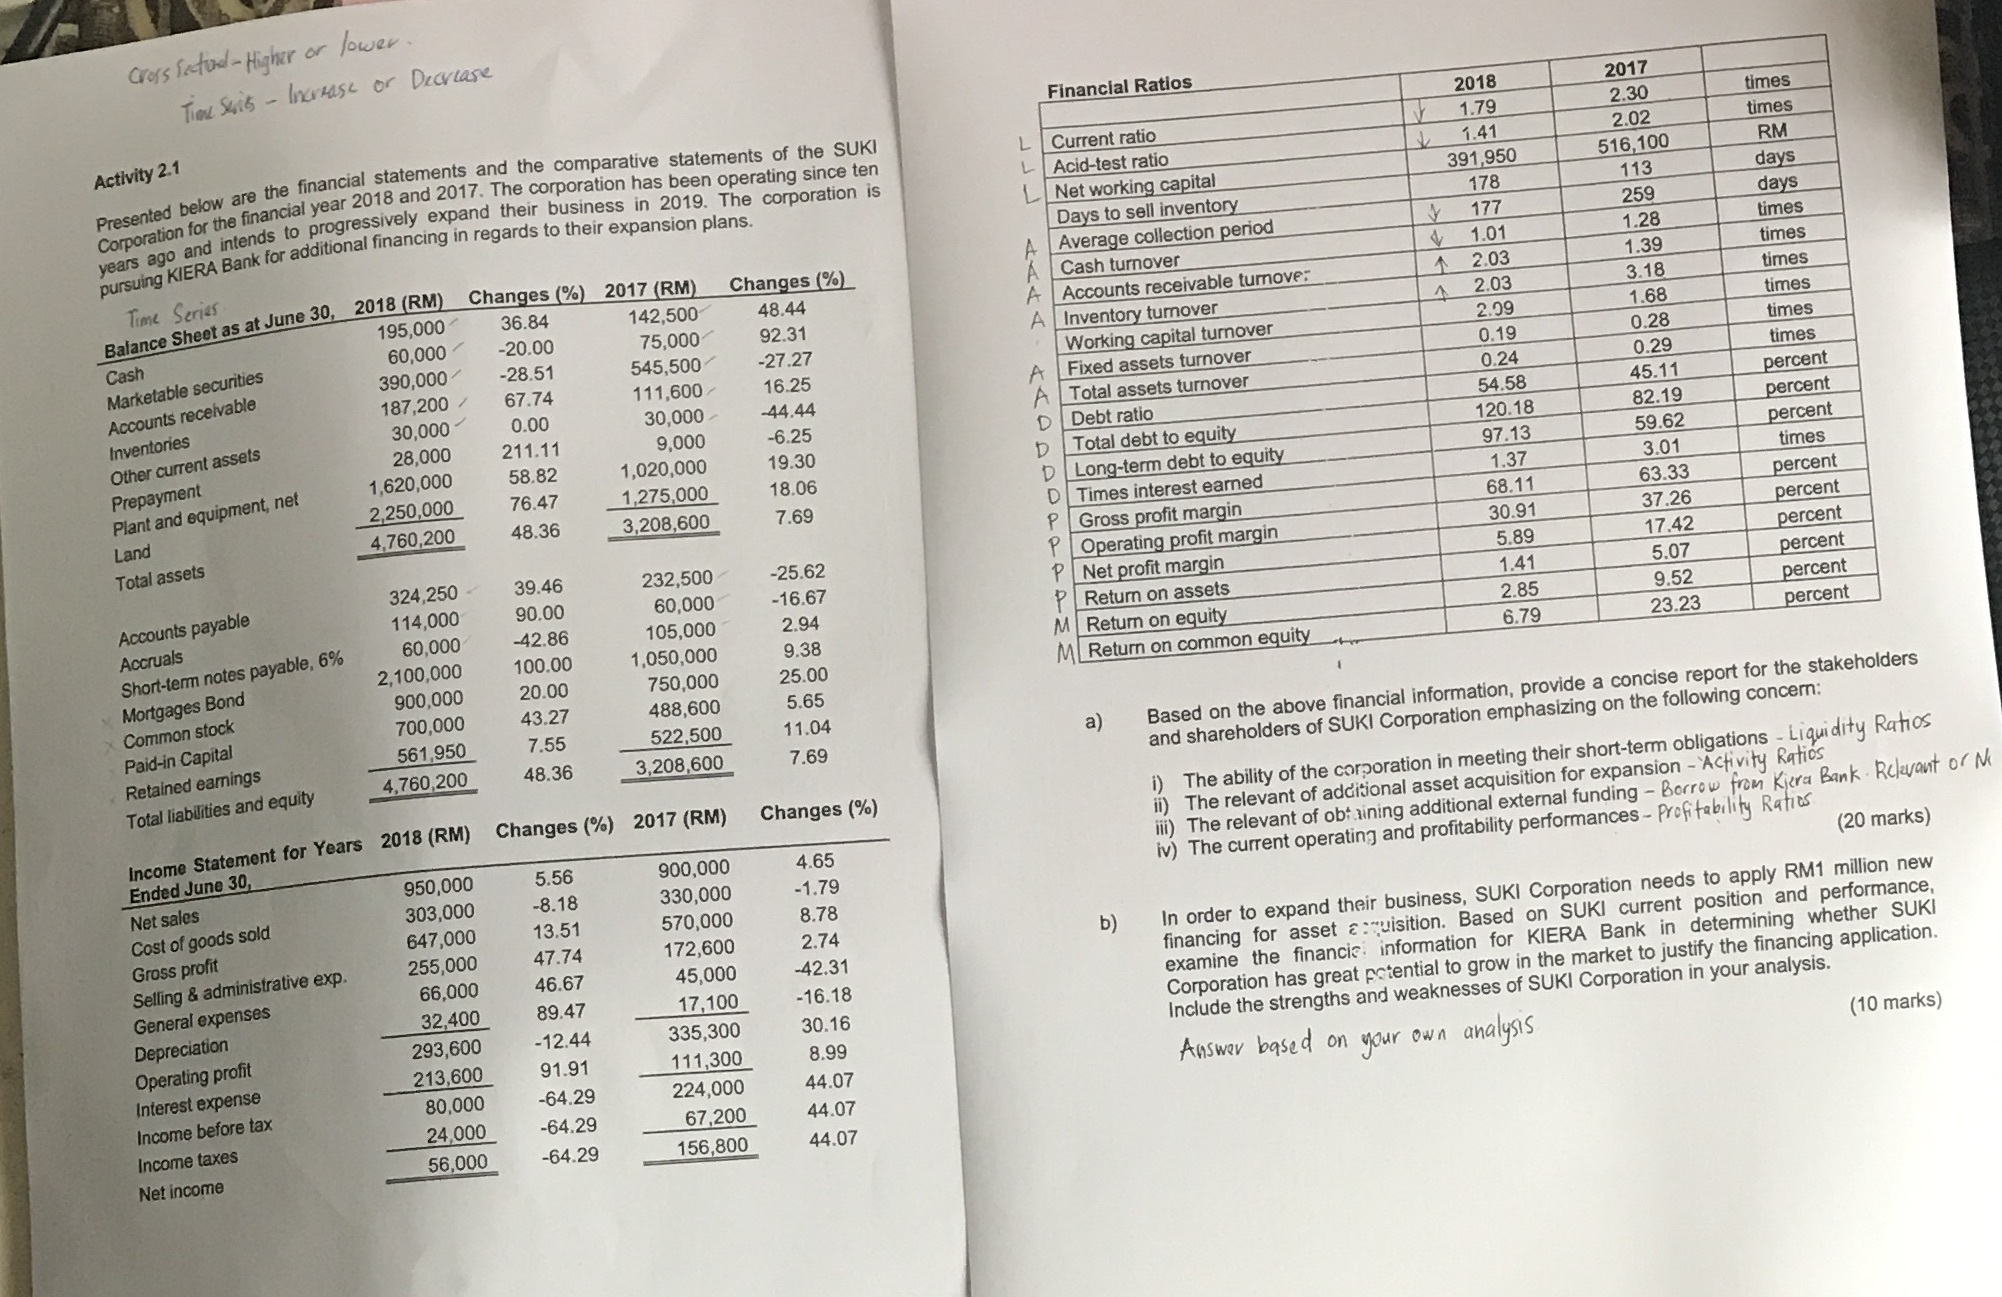
cross lectured - Higher or lower Time Series - Increase or Decrease Activity 2.1 Financial Ratios Presented below are the financial statements and the comparative statements of the SUKI 2018 2017 Corporation for the financial year 2018 and 2017. The corporation has been operating since ten L Current ratio 1.79 2.30 times years ago and intends to progressively expand their business in 2019. The corporation is Acid-test ratio 1.41 2.02 times pursuing KIERA Bank for additional financing in regards to their expansion plans. L Net working capital 391,950 516, 100 RM Days to sell inventory 178 113 days Time Series Balance Sheet as at June 30, 2018 (RM) Changes (%) 2017 (RM) A Average collection period 177 259 days Changes (%) 1.01 1.28 195,000 36.84 142,500 Cash turnover times 1.39 times Cash Marketable securities 60,000 -20.00 48.44 75,000 A Accounts receivable turnover 2.03 390,000 92.31 -28.51 545,500 A Inventory turnover 2.03 3.18 times Accounts receivable 2.09 1.68 187,200 -27.27 times 67.74 Working capital turnover Inventories 111,600 16.25 0.19 0.28 Other current assets 30,000 0.00 30,000 44.44 A Fixed assets turnover times A Total assets turnover 0.24 0.29 times 28,000 Prepayment 211.11 9,000 -6.25 54.58 45.11 percent Plant and equipment, net 1,620,000 58.82 1,020,000 Debt ratio 19.30 2,250,000 76.47 D Total debt to equity 120.18 82.19 percent 1,275,000 18.06 Long-term debt to equity 97.13 59.62 percent Land 48.36 1.37 3.01 times Total assets 4,760,200 3,208,600 7.69 D Times interest earned P Gross profit margin 68.11 63.33 percent 324,250 39.46 232,500 -25.62 P Operating profit margin 30.91 37.26 percent Accounts payable 60,000 5.89 percent Accruals 114,000 90.00 -16.67 P Net profit margin 17.42 Short-term notes payable, 6% 60,000 42.86 105,000 2.94 P Return on assets 1.41 5.07 percent Mortgages Bond 2, 100,000 100.00 1,050,000 9.38 M Return on equity 2.85 9.52 percent 25.00 6.79 23.23 percent Common stock 900,000 20.00 750,000 ML Return on common equity Paid-in Capital 700,000 43.27 488,600 5.65 Retained earnings 561,950 7.55 522,500 11.04 4,760,200 48.36 3,208,600 7.69 a) Based on the above financial information, provide a concise report for the stakeholders Total liabilities and equity and shareholders of SUKI Corporation emphasizing on the following concern: Income Statement for Years 2018 (RM) Changes (%) 2017 (RM) Changes (%) i) The ability of the corporation in meeting their short-term obligations - Liquidity Ratios Ended June 30, ii) The relevant of additional asset acquisition for expansion - Activity Ratios Net sales 950,000 5.56 900,000 4.65 ii) The relevant of obtaining additional external funding - Borrow from Kjera Bank Relevant or N Cost of goods sold 303,000 -8.18 330,000 -1.79 iv) The current operating and profitability performances - Profitability Ratios Gross profit 647,000 13.51 570,000 8.78 (20 marks) Selling & administrative exp. 255,000 47.74 172,600 2.74 b) In order to expand their business, SUKI Corporation needs to apply RM1 million new General expenses 66,000 46.67 45,000 -42.31 financing for asset :quisition. Based on SUKI current position and performance, Depreciation 32,400 89.47 17, 100 -16.18 examine the financial information for KIERA Bank in determining whether SUKI Operating profit 293,600 -12.44 335,300 30.16 Corporation has great potential to grow in the market to justify the financing application. Interest expense 213,600 91.91 111,300 8.99 Include the strengths and weaknesses of SUKI Corporation in your analysis. Income before tax 80,000 -64.29 224,000 44.07 Answer based on your own analysis (10 marks) Income taxes 24,000 -64.29 67,200 44.07 Net income 56,000 -64.29 156,800 44.07
Step by Step Solution
There are 3 Steps involved in it

Get step-by-step solutions from verified subject matter experts