

Question: please help me to understand how to answer these question A panel of economists provided forecasts of the US. economy for the rst six months
please help me to understand how to answer these question
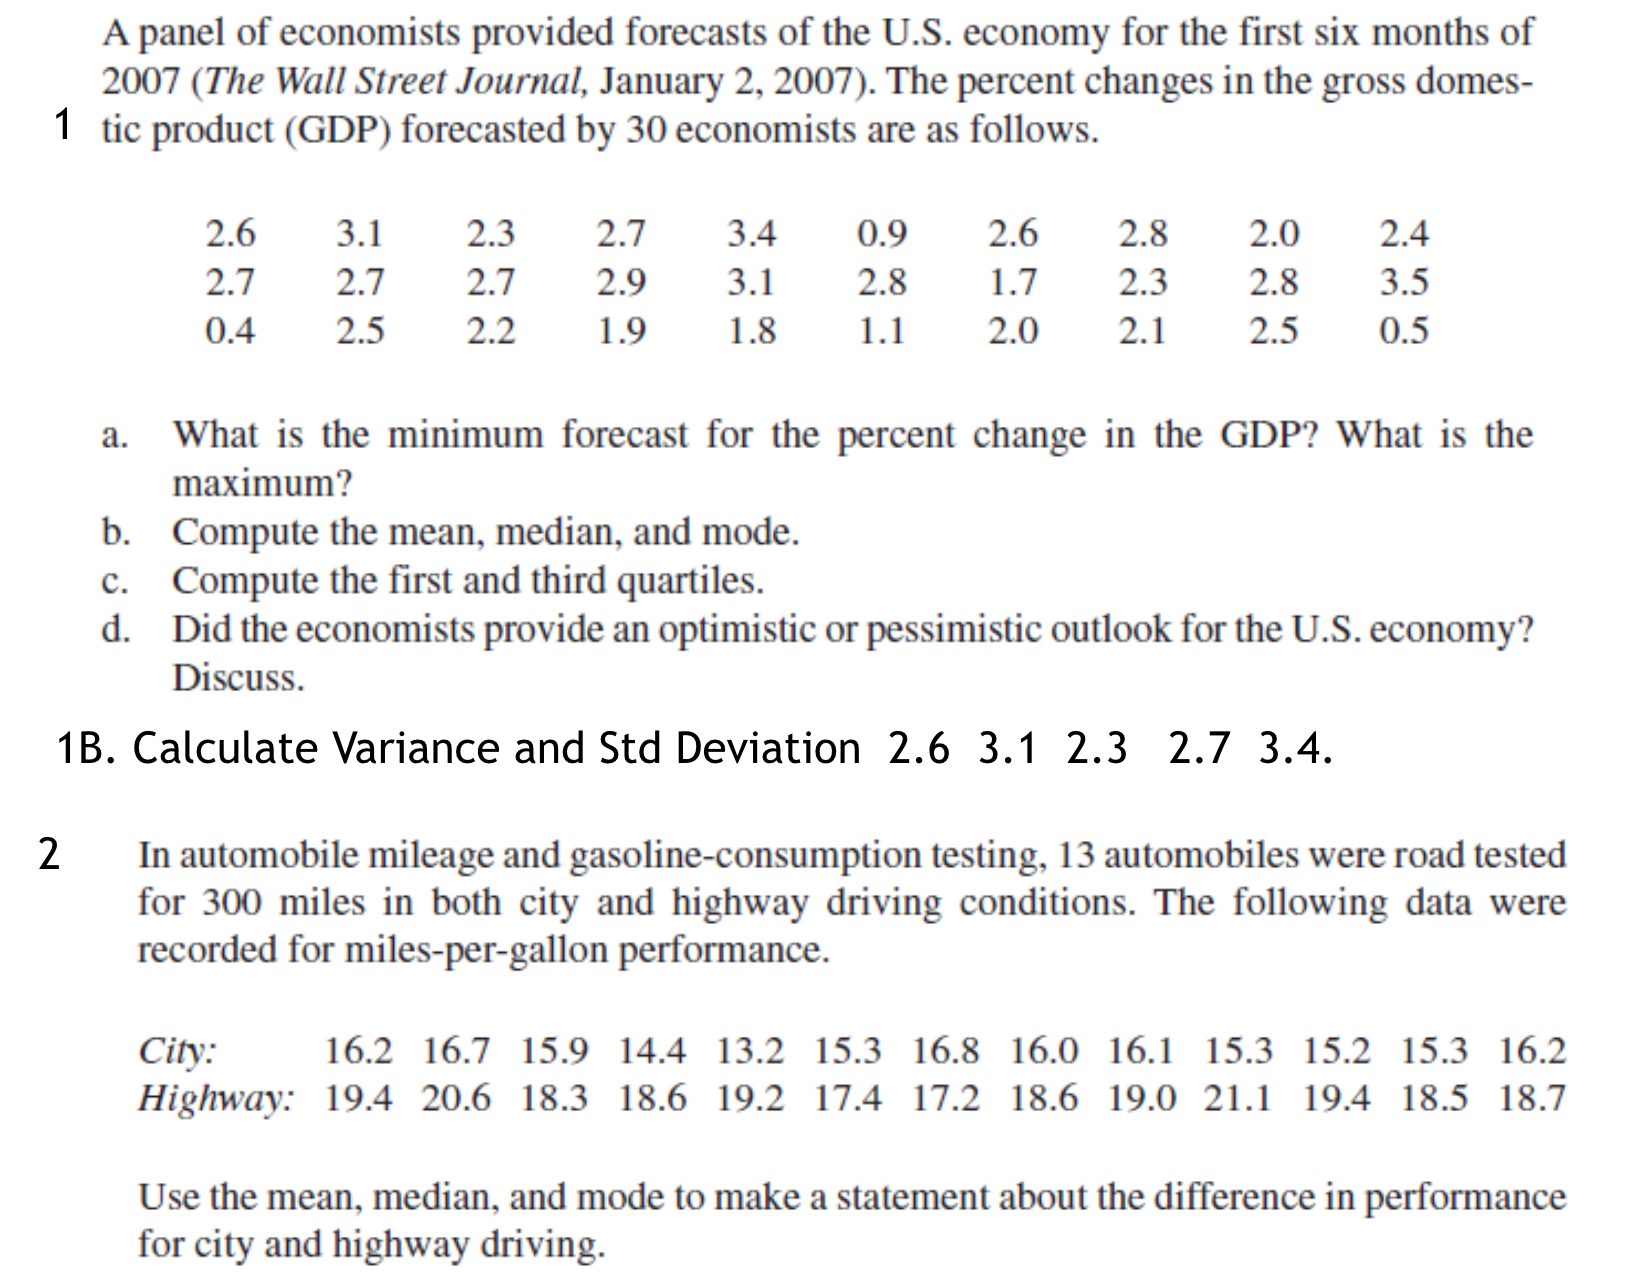
A panel of economists provided forecasts of the US. economy for the rst six months of 2007 (The Wall Street Journal, January 2, 2007). The percent changes in the gross domes- tic product (GDP) forecasted by 30 economists are as follows. 2.6 3.1 2.3 2.7 3.4 0.9 2.6 2.8 2.0 2.4 2.7 2.7 2.7 2.9 3.1 2.8 1.7 2.3 2.8 3.5 0.4 2.5 2.2 1.9 1.8 1.1 2.0 2.1 2.5 0.5 a. What is the minimum forecast for the percent change in the GDP? What is the maximum? b. Compute the mean, median, and mode. Compute the rst and third quartiles. Did the economists provide an optimistic or pessimistic outlook for the US. economy? Discuss. en 13. Calculate Variance and Std Deviation 2.6 3.1 2.3 2.7 3.4. 2 In automobile mileage and gasoline-consumption testing, 13 automobiles were road tested for 300 miles in both city and highway driving conditions. The following data were recorded for miles-per-gallon performance. City: 16.2 16.7 15.9 14.4 13.2 15.3 16.8 16.0 16.1 15.3 15.2 15.3 16.2 Highway: 19.4 20.6 18.3 18.6 19.2 17.4 17.2 18.6 19.0 21.1 19.4 18.5 18.7 Use the mean, median, and mode to make a statement about the difference in performance for city and highway driving
Step by Step Solution
There are 3 Steps involved in it

Get step-by-step solutions from verified subject matter experts