Question: please help me understand. #1 LOGIC COMPANY Comparative Income Statement For Years Ended December 31, 2017 and 2018 2018 2017 Gross sales $19, 200 $15,
please help me understand.
#1
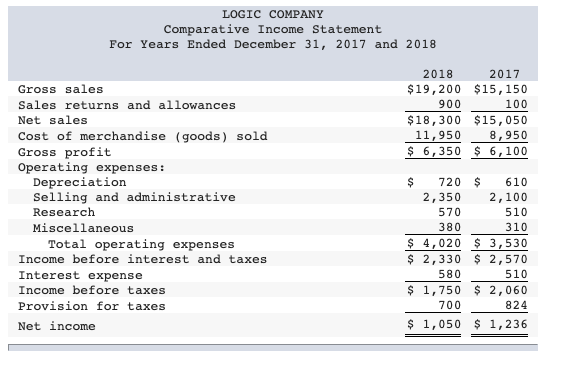
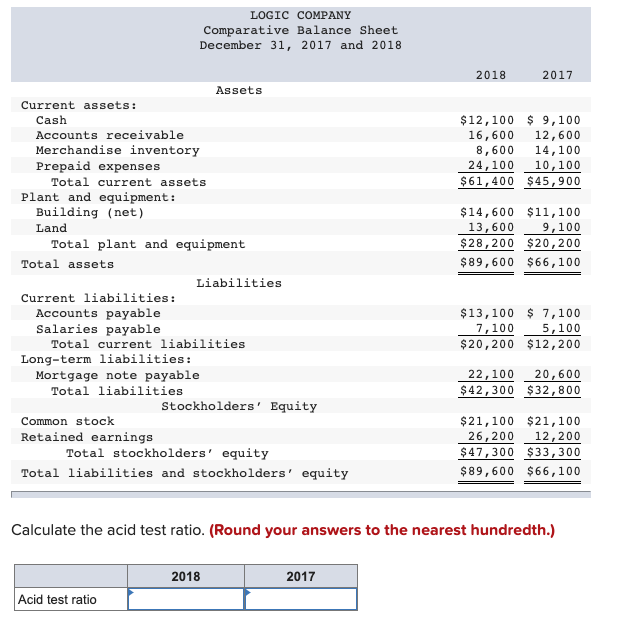
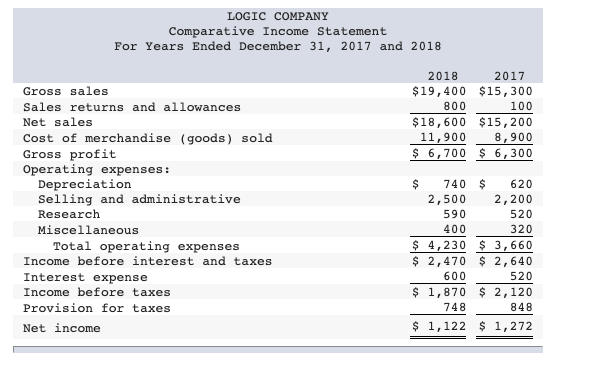
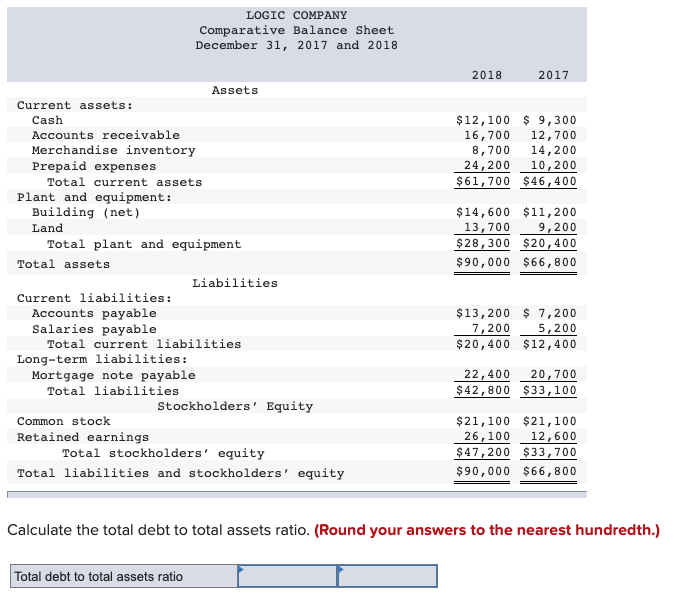
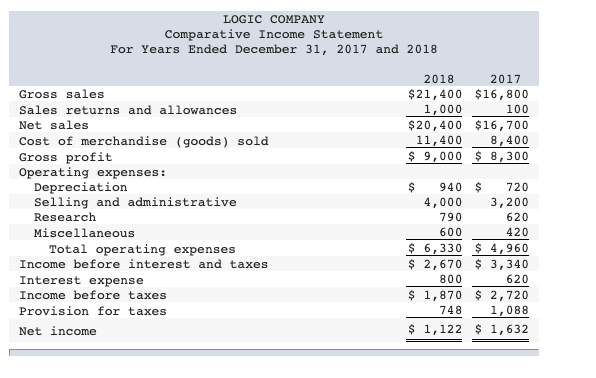
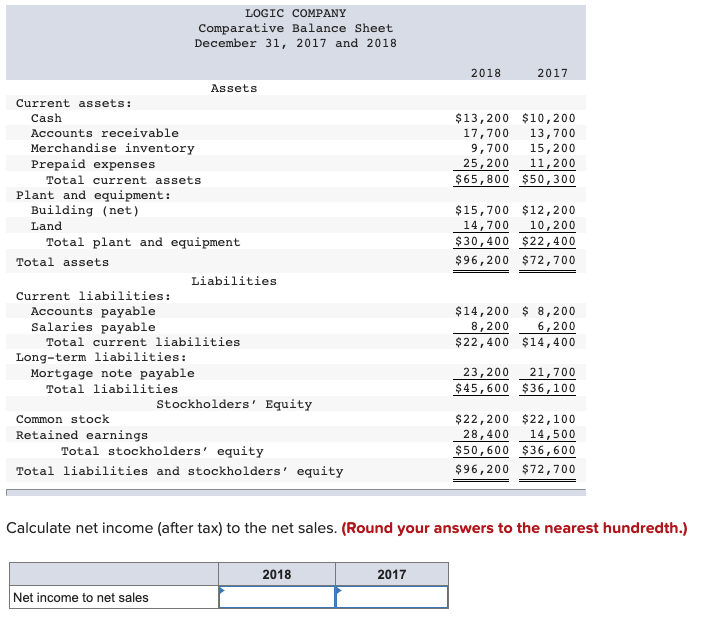
LOGIC COMPANY Comparative Income Statement For Years Ended December 31, 2017 and 2018 2018 2017 Gross sales $19, 200 $15, 150 Sales returns and allowances 900 100 Net sales $18, 300 $15 , 050 Cost of merchandise (goods) sold 11, 950 8, 950 Gross profit $ 6,350 $ 6, 100 Operating expenses: Depreciation S 720 610 Selling and administrative 2, 350 2, 100 Research 570 510 Miscellaneous 380 310 Total operating expenses $ 4,020 $ 3,530 Income before interest and taxes $ 2,330 $ 2,570 Interest expense 580 510 Income before taxes $ 1, 750 $ 2, 060 Provision for taxes 700 824 Net income $ 1, 050 $ 1, 236LOGIC COMPANY Comparative Balance Sheet December 31, 2017 and 2018 2018 2017 Assets Current assets: Cash $12, 100 $ 9, 100 Accounts receivable 16, 600 12, 600 Merchandise inventory 8, 600 14, 100 Prepaid expenses 24, 100 10, 100 Total current assets $61, 400 $45,900 Plant and equipment: Building (net) $14, 600 $11, 100 Land 13, 600 9, 100 Total plant and equipment $28, 200 $20, 200 Total assets $89, 600 $66 , 100 Liabilities Current liabilities: Accounts payable $13, 100 $ 7, 100 Salaries payable 7, 100 5, 100 Total current liabilities $20, 200 $12 , 200 Long-term liabilities: Mortgage note payable 22, 100 20,600 Total liabilities $42, 300 $32, 800 Stockholders ' Equity Common stock $21, 100 $21, 100 Retained earnings 26, 200 12 , 200 Total stockholders' equity $47, 300 $33, 300 Total liabilities and stockholders' equity $89, 600 $66, 100 Calculate the acid test ratio. (Round your answers to the nearest hundredth.) 2018 2017 Acid test ratioLOGIC COMPANY Comparative Income Statement For Years Ended December 31, 2017 and 2018 2018 2017 Gross sales $19, 400 $15, 300 Sales returns and allowances 800 100 Net sales $18, 600 $15 , 200 Cost of merchandise (goods) sold 11, 900 8, 900 Gross profit $ 6,700 $ 6, 300 Operating expenses: Depreciation S 740 $ 620 Selling and administrative 2,500 2, 200 Research 590 520 Miscellaneous 400 320 Total operating expenses $ 4, 230 $ 3, 660 Income before interest and taxes $ 2,470 $ 2, 640 Interest expense 600 520 Income before taxes $ 1, 870 $ 2, 120 Provision for taxes 748 848 Net income $ 1, 122 $ 1, 272LOGIC COMPANY Comparative Balance Sheet December 31, 2017 and 2018 2018 2017 Assets Current assets: Cash $12, 100 $ 9,300 Accounts receivable 16,700 12 , 700 Merchandise inventory 8, 700 14, 200 Prepaid expenses 24, 200 10, 200 Total current assets $61, 700 $46, 400 Plant and equipment: Building (net) $14,600 $11, 200 Land 13, 700 9, 200 Total plant and equipment $28, 300 $20, 400 Total assets $90, 000 $66, 800 Liabilities Current liabilities: Accounts payable $13, 200 $ 7, 200 Salaries payable 7, 200 5,200 Total current liabilities $20, 400 $12, 400 Long-term liabilities: Mortgage note payable 22, 400 20, 700 Total liabilities $42, 800 $33, 100 Stockholders' Equity Common stock $21, 100 $21, 100 Retained earnings 26 , 100 12, 600 Total stockholders' equity $47, 200 $33, 700 Total liabilities and stockholders' equity $90, 000 $66, 800 Calculate the total debt to total assets ratio. (Round your answers to the nearest hundredth.) Total debt to total assets ratioLOGIC COMPANY Comparative Income Statement For Years Ended December 31, 2017 and 2018 2018 2017 Gross sales $21, 400 $16, 800 Sales returns and allowances 1,000 100 Net sales $20, 400 $16, 700 Cost of merchandise (goods) sold 11, 400 8, 400 Gross profit $ 9,000 $ 8, 300 Operating expenses: Depreciation 940 S 720 Selling and administrative 4,000 3, 200 Research 790 620 Miscellaneous 600 420 Total operating expenses $ 6,330 $ 4,960 Income before interest and taxes $ 2, 670 $ 3,340 Interest expense 800 620 Income before taxes $ 1, 870 $ 2, 720 Provision for taxes 748 1, 088 Net income $ 1, 122 $ 1, 632LOGIC COMPANY Comparative Balance Sheet December 31, 2017 and 2018 2018 2017 Assets Current assets: Cash $13, 200 $10, 200 Accounts receivable 17,700 13, 700 Merchandise inventory 9, 700 15 , 200 Prepaid expenses 25, 200 11, 200 Total current assets $65 , 800 $50, 300 Plant and equipment: Building (net) $15, 700 $12, 200 Land 14,700 10, 200 Total plant and equipment $30, 400 $22 , 400 Total assets $96, 200 $72 , 700 Liabilities Current liabilities: Accounts payable $14, 200 $ 8, 200 Salaries payable 8, 200 6,200 Total current liabilities $22 , 400 $14, 400 Long-term liabilities: Mortgage note payable 23, 200 21, 700 Total liabilities $45, 600 $36, 100 Stockholders ' Equity Common stock $22, 200 $22, 100 Retained earnings 28, 400 14, 500 Total stockholders' equity $50 , 600 $36, 600 Total liabilities and stockholders' equity $96, 200 $72, 700 Calculate net income (after tax) to the net sales. (Round your answers to the nearest hundredth.) 2018 2017 Net income to net sales
Step by Step Solution
There are 3 Steps involved in it
1 Expert Approved Answer
Step: 1 Unlock
Question Has Been Solved by an Expert!
Get step-by-step solutions from verified subject matter experts
Step: 2 Unlock
Step: 3 Unlock
Students Have Also Explored These Related Accounting Questions!