

Question: Please help me understand: A particular professor has noticed that the number of people, y, who complain about his attitude is dependent on the number
Please help me understand:
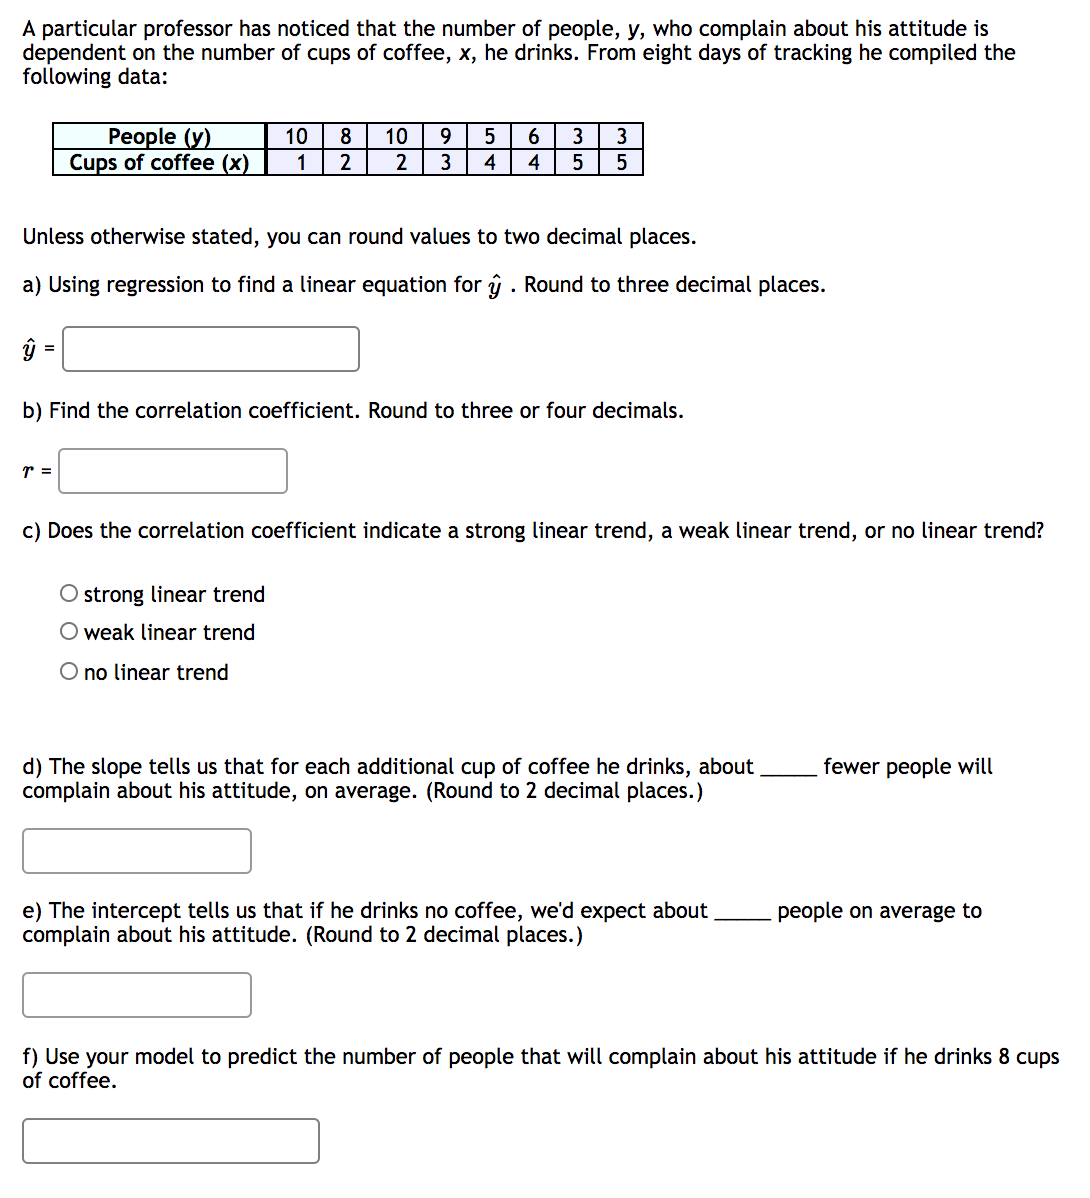
A particular professor has noticed that the number of people, y, who complain about his attitude is dependent on the number of cups of coffee, x, he drinks. From eight days of tracking he compiled the following data: mun-\"nu Cu-s of coffee x nun-Inna Unless otherwise stated, you can round values to two decimal places. a) Using regression to find a linear equation for y' . Round to three decimal places. b) Find the correlation coefficient. Round to three or four decimals. c) Does the correlation coefficient indicate a strong linear trend, a weak linear trend, or no linear trend? 0 strong linear trend 0 weak linear trend 0 no linear trend d) The slope tells us that for each additional cup of coffee he drinks, about fewer people will complain about his attitude, on average. (Round to 2 decimal places.) :1 e) The intercept tells us that if he drinks no coffee, we'd expect about people on average to complain about his attitude. (Round to 2 decimal places.) :1 f) Use your model to predict the number of people that will complain about his attitude if he drinks 8 cups of coffee
Step by Step Solution
There are 3 Steps involved in it

Get step-by-step solutions from verified subject matter experts