

Question: Please help me understand how to approach my Results Section for this homework assignment. I really don't understand the range, mean, SD, median, mode, and
Please help me understand how to approach my "Results Section" for this homework assignment.
I really don't understand the range, mean, SD, median, mode, and frequency table for a survey or how to begin.
INSTRUCTIONS:
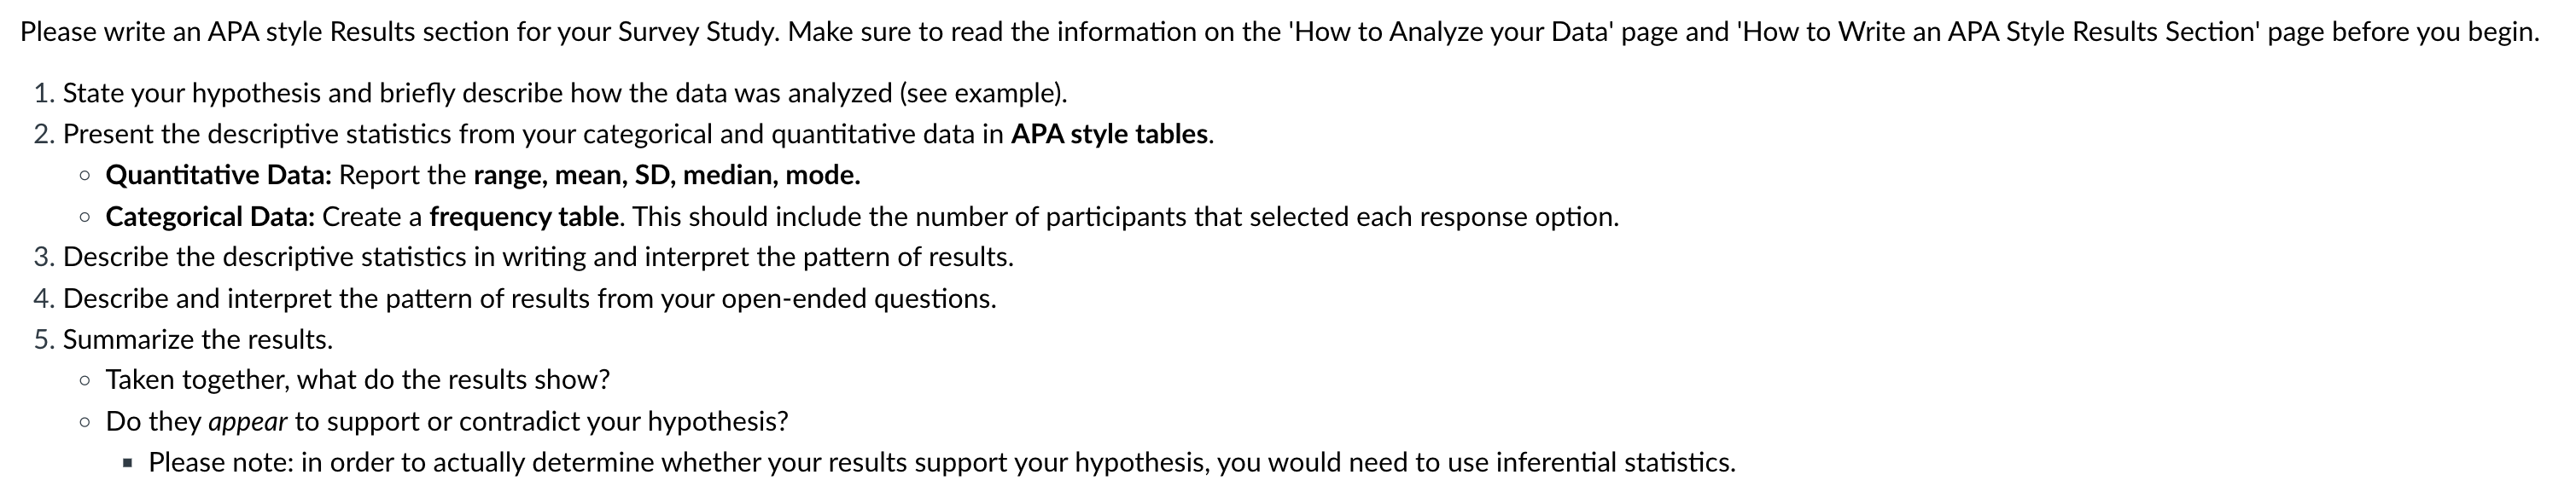
Please write an APA style Results section for your Survey Study. Make sure to read the information on the 'How to Analyze your Data' page and 'How to Write an APA Style Results Section' page before you begin. 1. State your hypothesis and briefly describe how the data was analyzed (see example). 2. Present the descriptive statistics from your categorical and quantitative data in APA style tables. o Quantitative Data: Report the range, mean, SD, median, mode. o Categorical Data: Create a frequency table. This should include the number of participants that selected each response option. 3. Describe the descriptive statistics in writing and interpret the pattern of results. 4. Describe and interpret the pattern of results from your open-ended questions. 5. Summarize the results. o Taken together, what do the results show? o Do they appear to support or contradict your hypothesis? = Please note: in order to actually determine whether your results support your hypothesis, you would need to use inferential statistics
Step by Step Solution
There are 3 Steps involved in it

Get step-by-step solutions from verified subject matter experts