

Question: Please help me understand how to read this graph and work through this problem Assume that we want to construct a confidence interval. Do one
Please help me understand how to read this graph and work through this problem
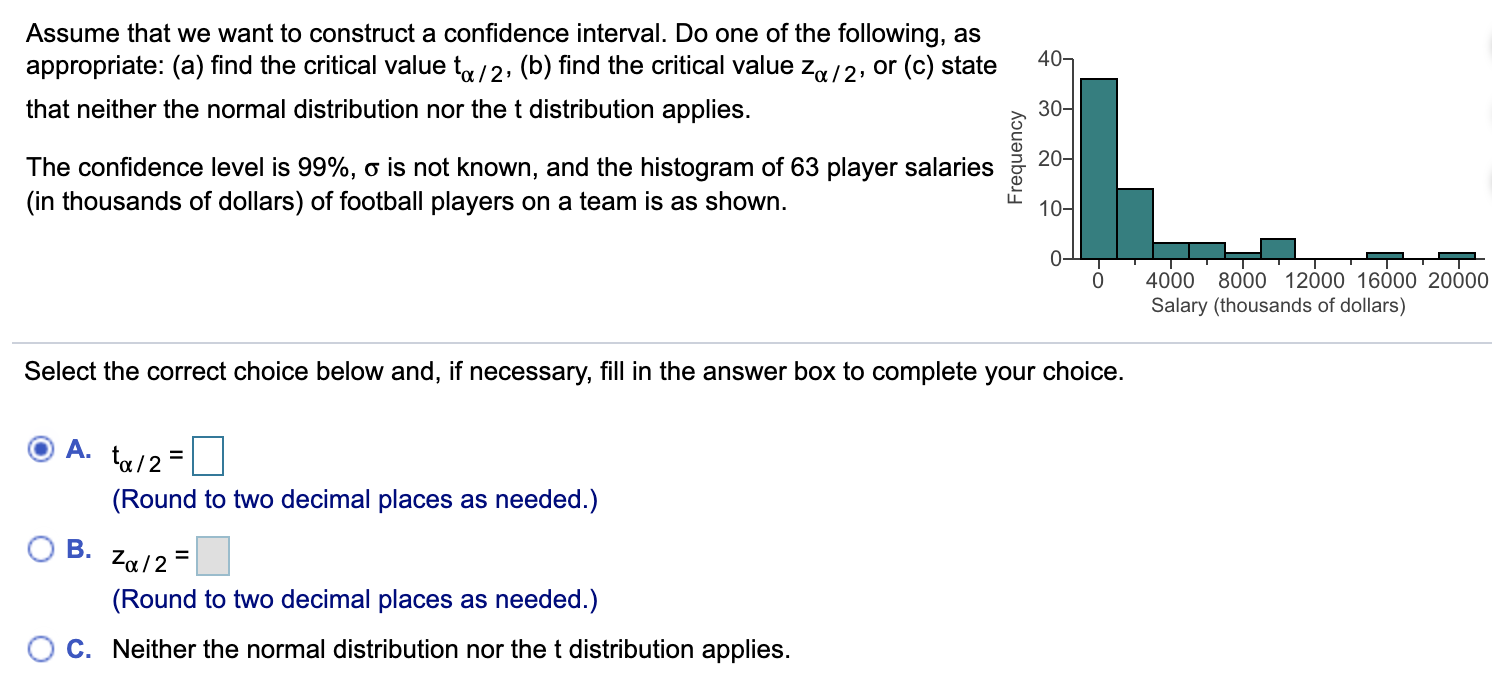
Assume that we want to construct a confidence interval. Do one of the following, as appropriate: (a) find the critical value to /2, (b) find the critical value Za /2, or (c) state 40- that neither the normal distribution nor the t distribution applies. 30- The confidence level is 99%, o is not known, and the histogram of 63 player salaries 20- (in thousands of dollars) of football players on a team is as shown. Frequency 10- 4000 8000 12000 16000 20000 Salary (thousands of dollars) Select the correct choice below and, if necessary, fill in the answer box to complete your choice. O A. to/2= (Round to two decimal places as needed.) O B. Za/2 = (Round to two decimal places as needed.) O C. Neither the normal distribution nor the t distribution applies
Step by Step Solution
There are 3 Steps involved in it

Get step-by-step solutions from verified subject matter experts