

Question: please help me understand these problems 1 The accompanying table describes the random variable x, the numbers of adults in groups of five who reported
please help me understand these problems
1
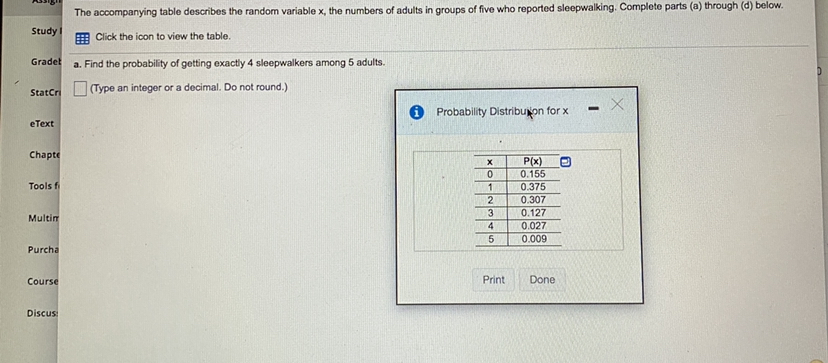
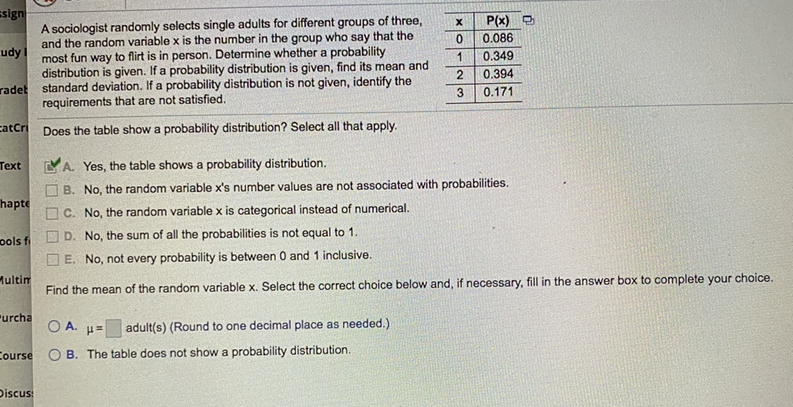
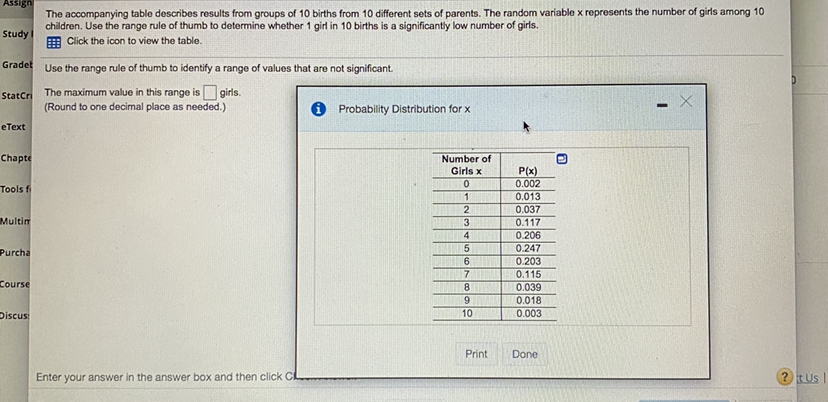
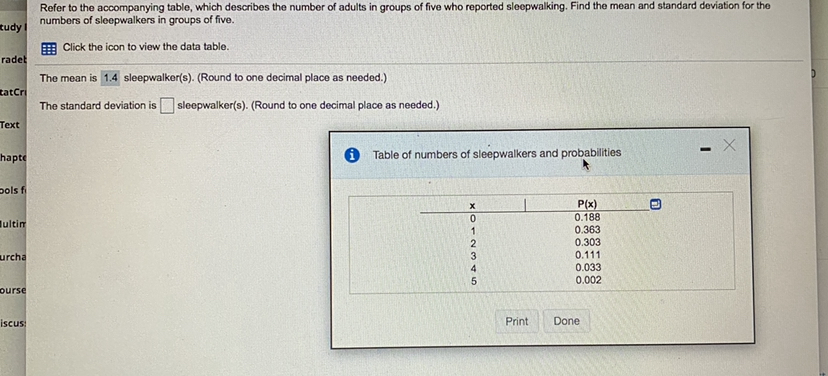
The accompanying table describes the random variable x, the numbers of adults in groups of five who reported sleepwalking. Complete parts (a) through (d) below. Study Click the icon to view the table. Gradet a. Find the probability of getting exactly 4 sleepwalkers among 5 adults. StatCri (Type an integer or a decimal. Do not round.) eText Probability Distribution for x - X Chapto X P(x] Tools f 0.155 1 0.375 2 0.307 Multin 3 0.127 4 0.027 Purcha 5 0.009 Course Print Done Discussign A sociologist randomly selects single adults for different groups of three, X P(x) udy and the random variable x is the number in the group who say that the 0 0.086 most fun way to flirt is in person. Determine whether a probability distribution is given. If a probability distribution is given, find its mean and 1 0.349 radet standard deviation. If a probability distribution is not given, identify the 2 0.394 requirements that are not satisfied. 3 0.171 catCri Does the table show a probability distribution? Select all that apply. Text LY A. Yes, the table shows a probability distribution. B. No, the random variable x's number values are not associated with probabilities. hapte C. No, the random variable x is categorical instead of numerical. pols f D. No, the sum of all the probabilities is not equal to 1. E. No, not every probability is between 0 and 1 inclusive. Multin Find the mean of the random variable x. Select the correct choice below and, if necessary, fill in the answer box to complete your choice. urcha O A. (= adult(s) (Round to one decimal place as needed.) Course O B. The table does not show a probability distribution. Discus:ASSIEn The accompanying table describes results from groups of 10 births from 10 different sets of parents. The random variable x represents the number of girls among 10 Study I children. Use the range rule of thumb to determine whether 1 girl in 10 births is a significantly low number of girls. Click the icon to view the table. Gradet Use the range rule of thumb to identify a range of values that are not significant. StatCri The maximum value in this range is girls. (Round to one decimal place as needed.) i Probability Distribution for x - X eText Chapte Number of Girls x P(x] Tools f 0.002 0.013 2 0.037 Multin 3 0.117 0.206 Purcha 5 0.247 0.203 7 Course 0.115 0.039 9 0.018 Discus: 10 0.003 Print Done Enter your answer in the answer box and then click C ?t UsRefer to the accompanying table, which describes the number of adults in groups of five who reported sleepwalking. Find the mean and standard deviation for the tudy I numbers of sleepwalkers in groups of five. Click the icon to view the data table. radet The mean is 1.4 sleepwalker(s). (Round to one decimal place as needed.) catCri The standard deviation is sleepwalker(s). (Round to one decimal place as needed.) Text hapto Table of numbers of sleepwalkers and probabilities - X pols f P(x) lultim 0.188 0.363 urcha 0.303 0.111 0.033 ourse 0.002 iscus Print Done
Step by Step Solution
There are 3 Steps involved in it

Get step-by-step solutions from verified subject matter experts