

Question: Please help me understand these steps and their answers > H drakeblackboardcom C [I i 5' ' Content Take Test: Test 3 Ch. 14-15 Stat
Please help me understand these steps and their answers
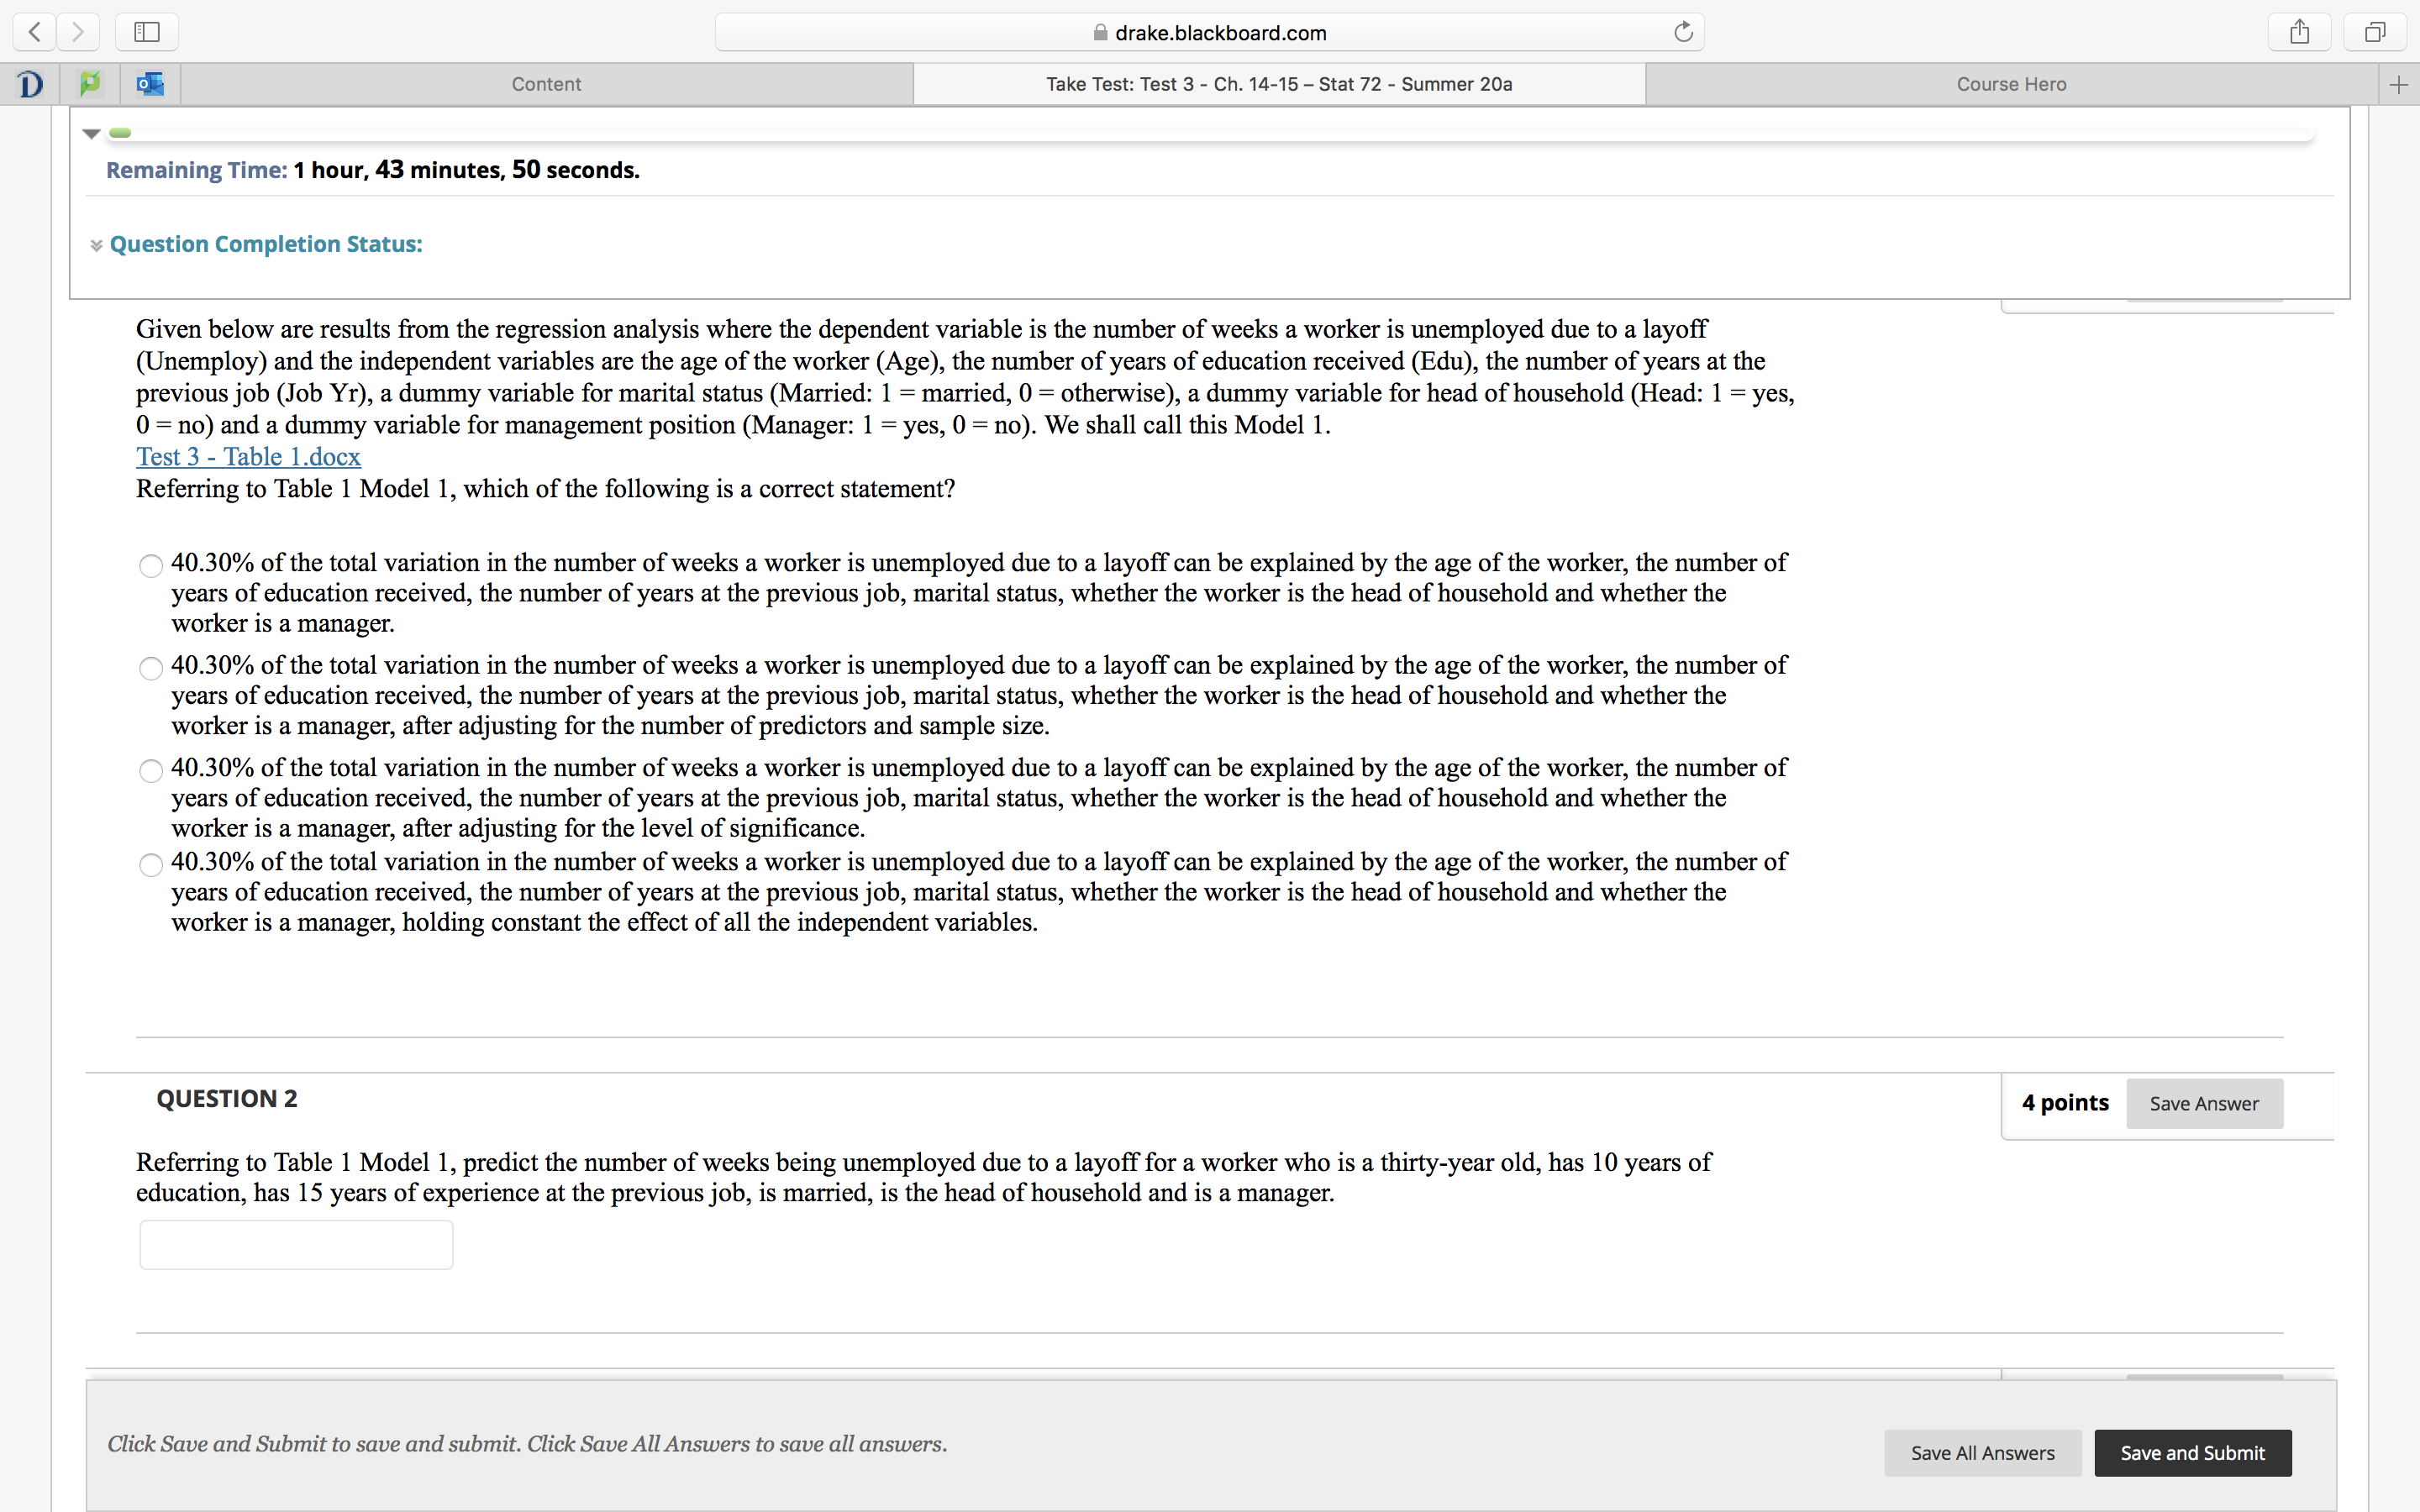
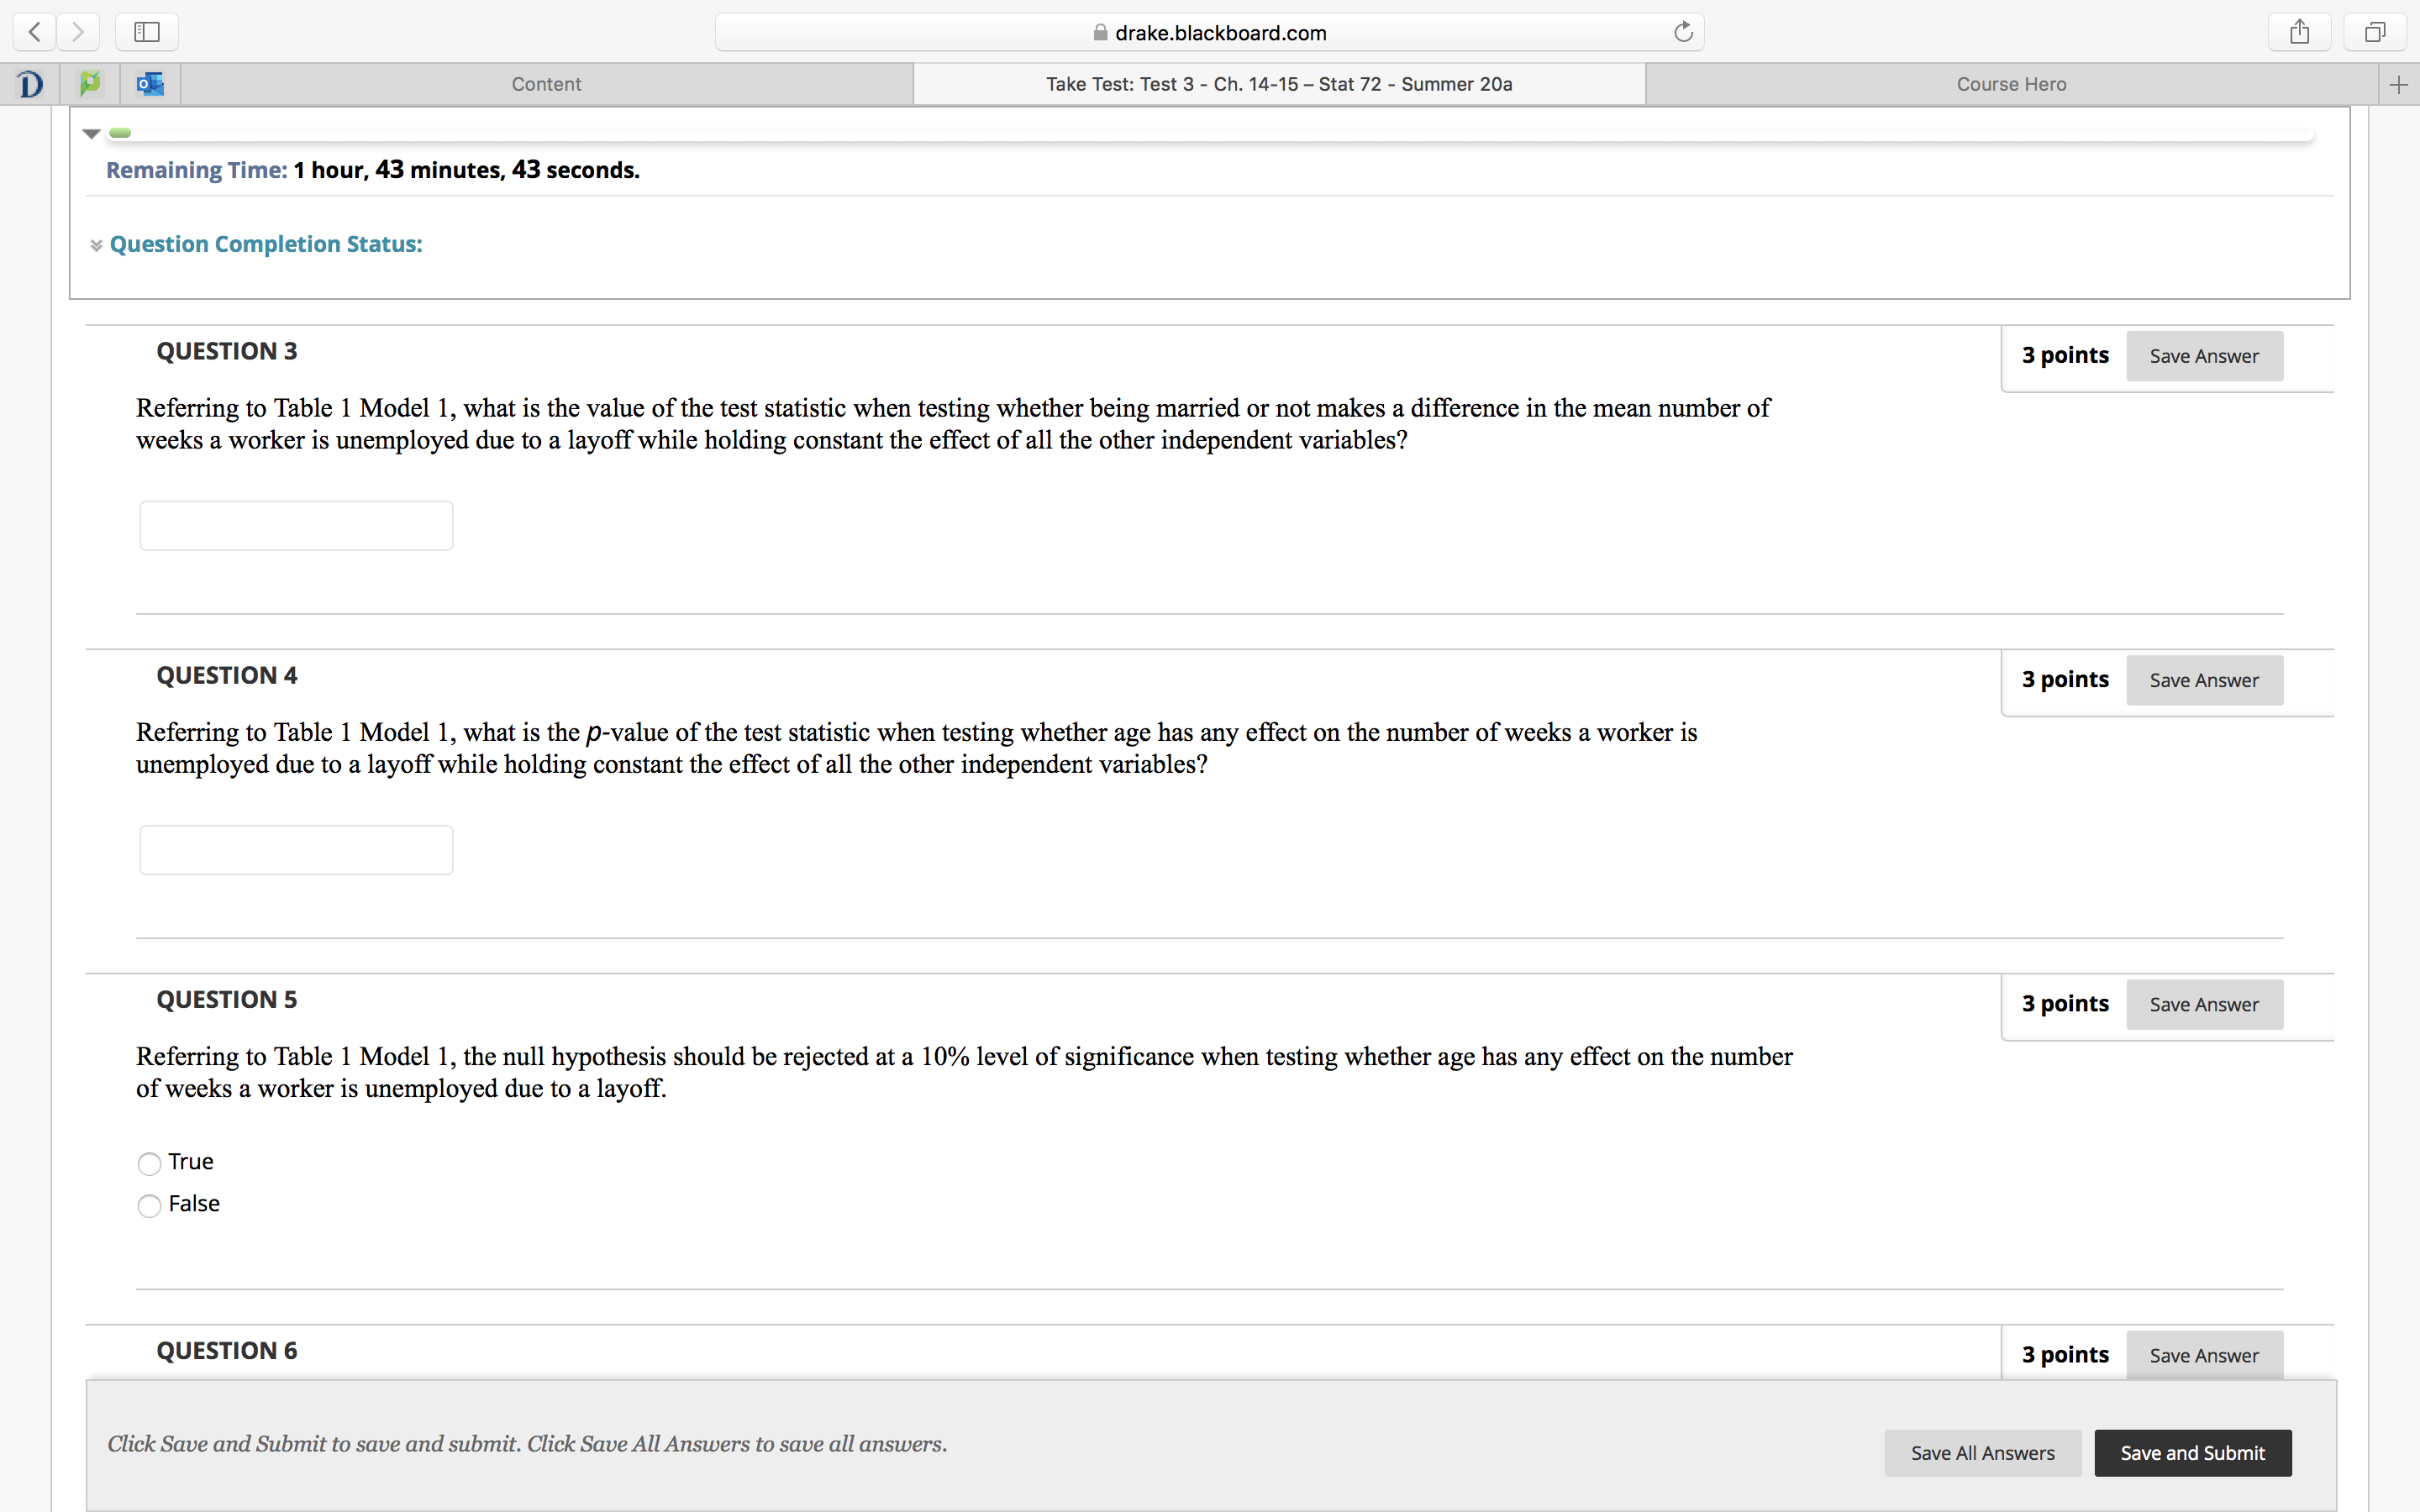
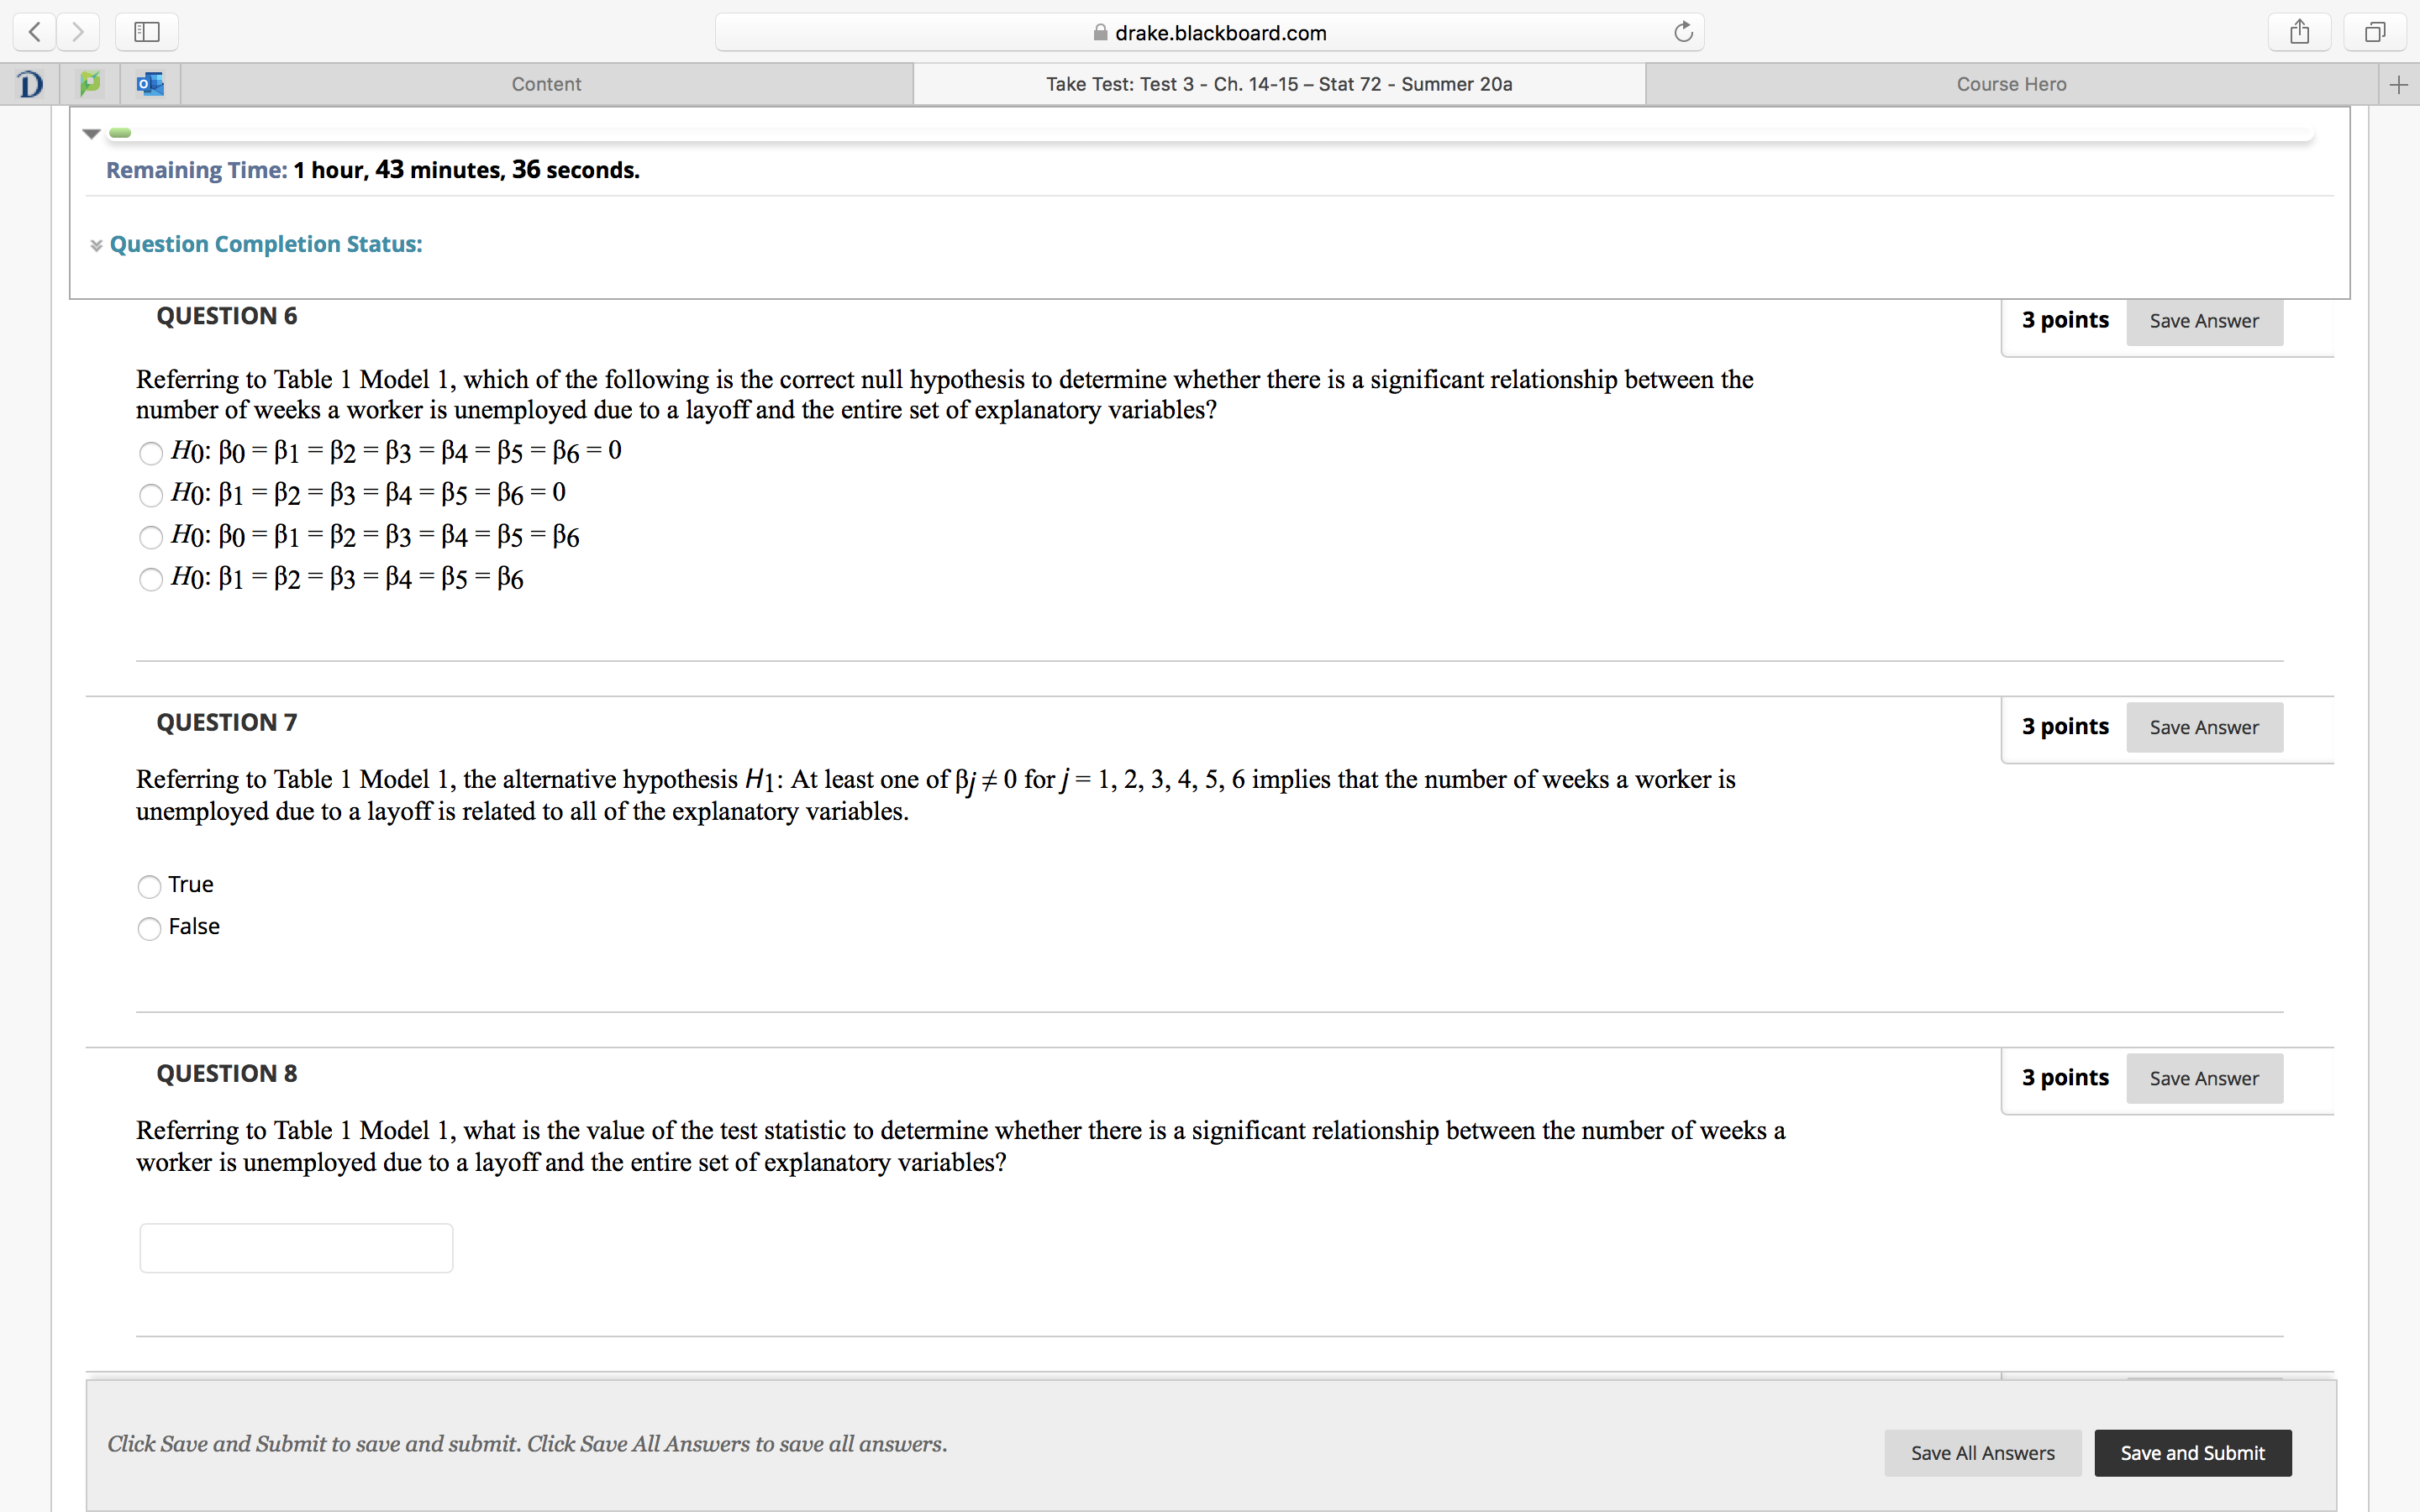
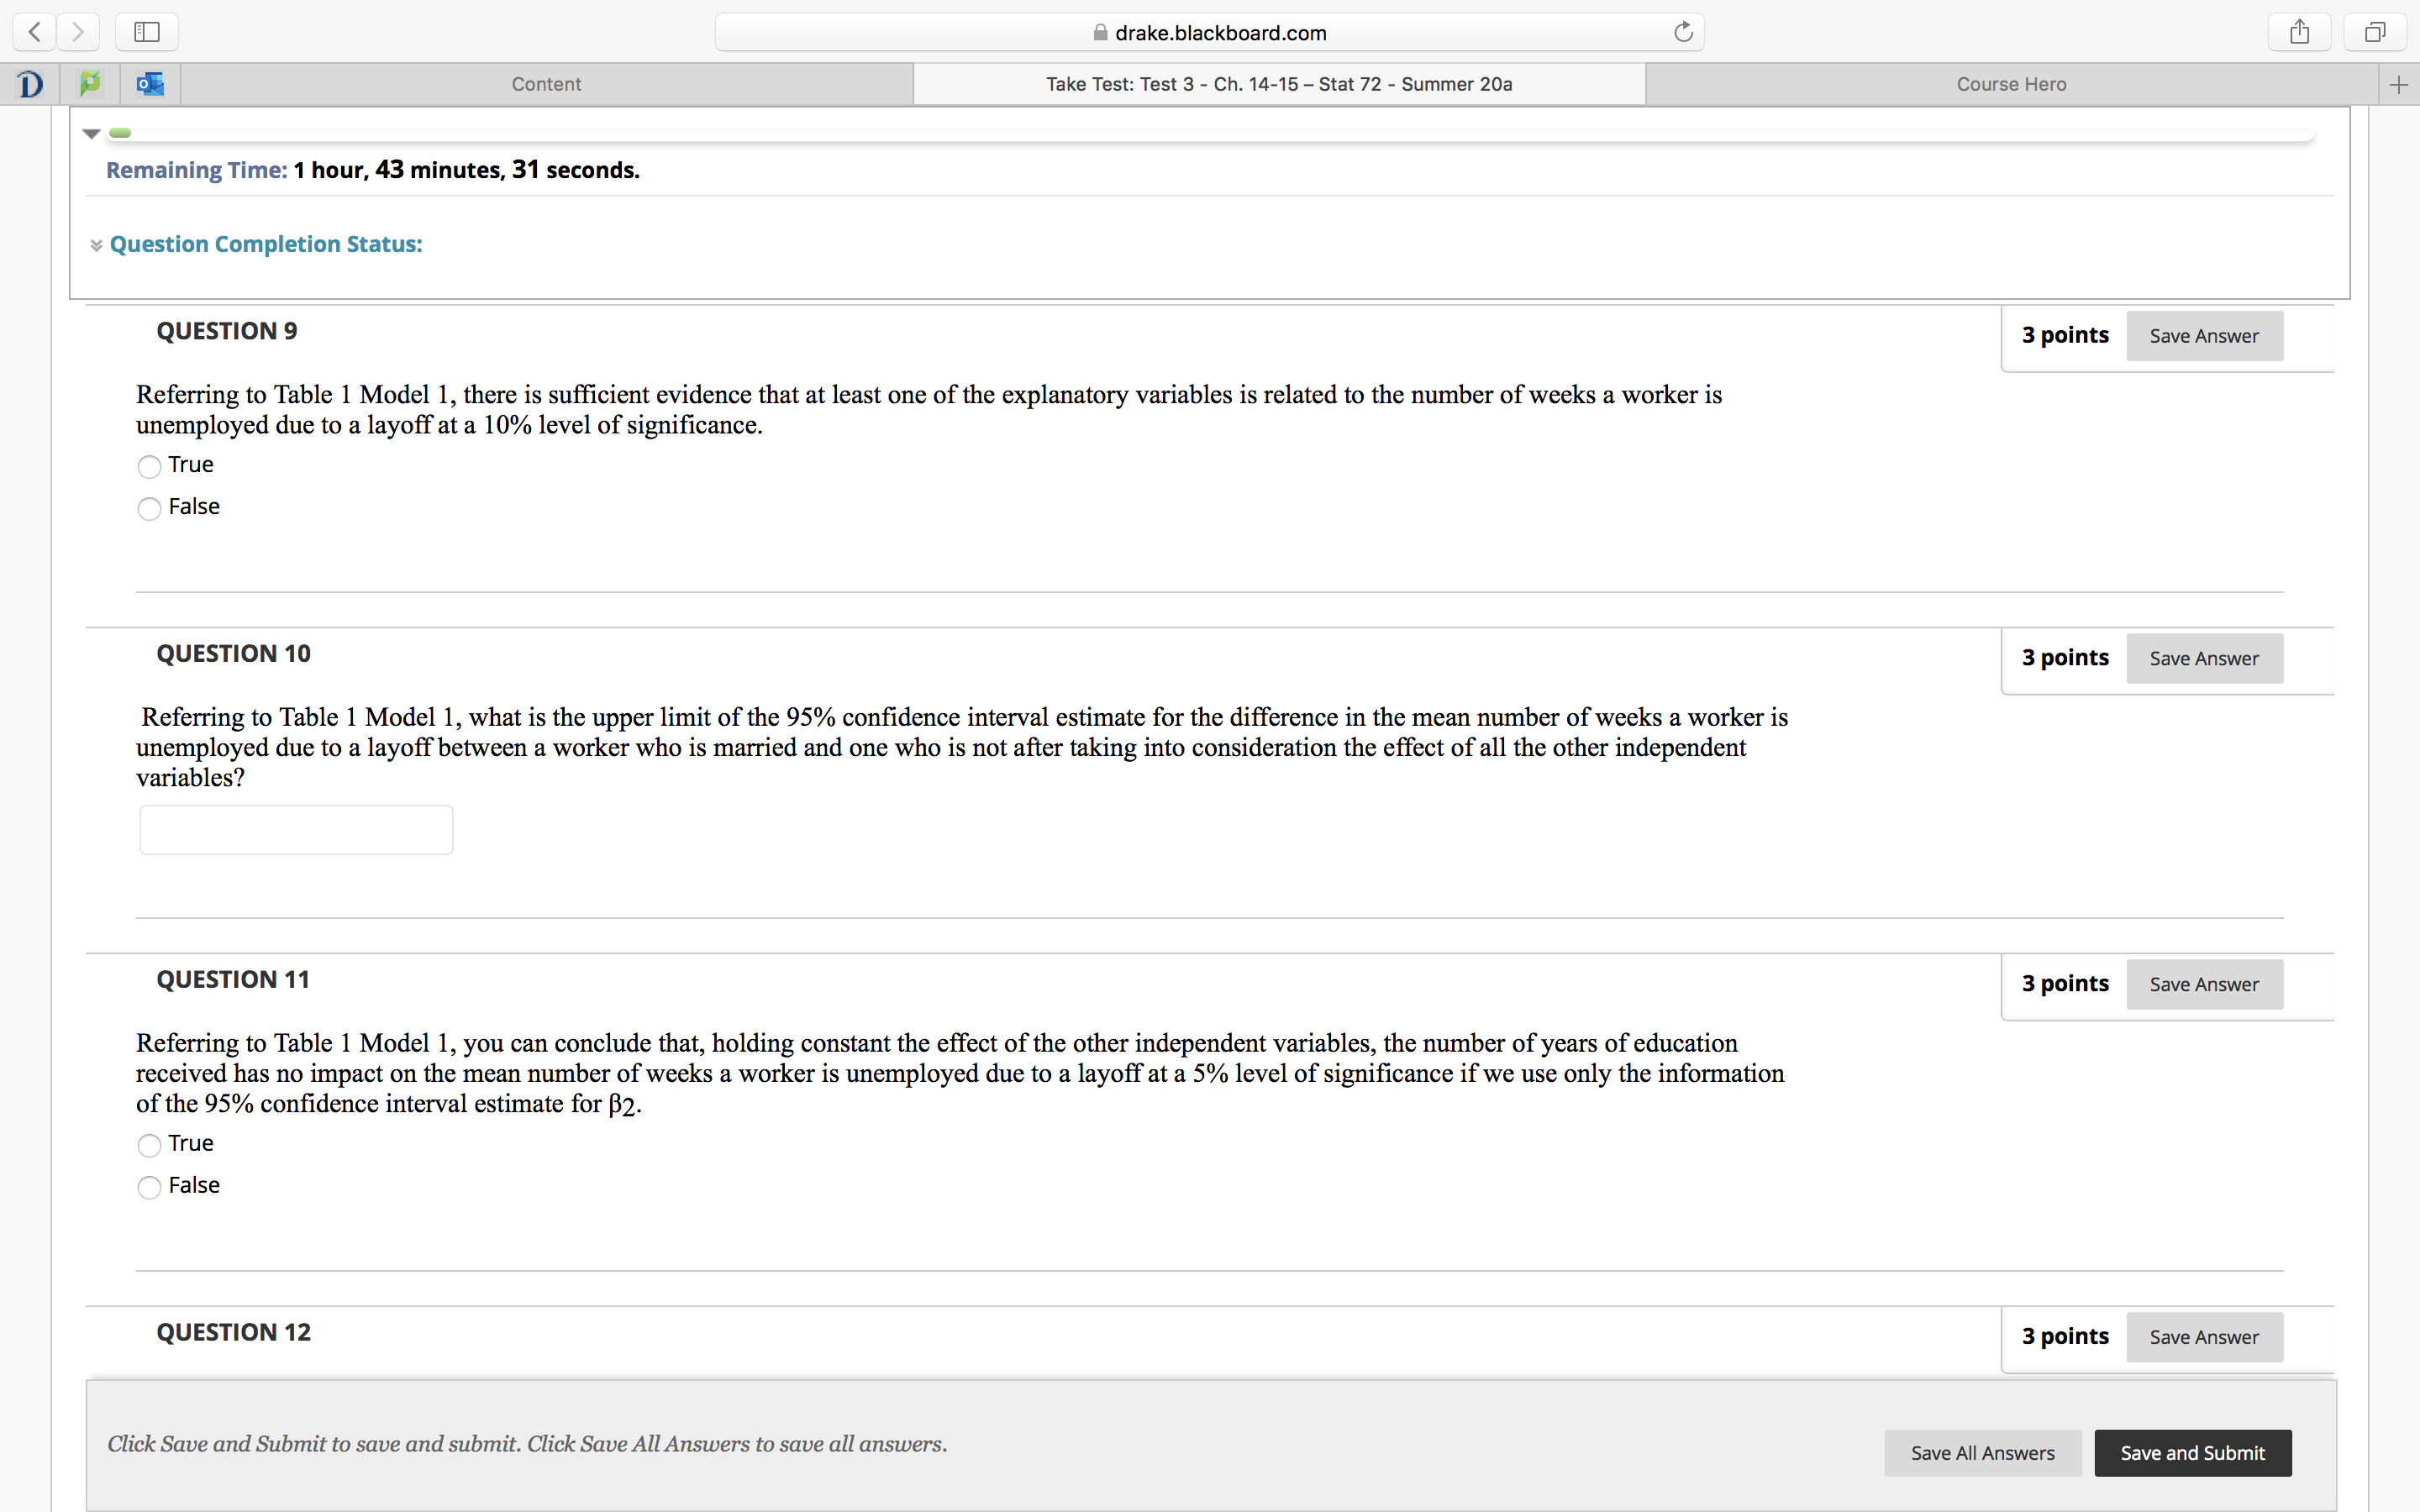
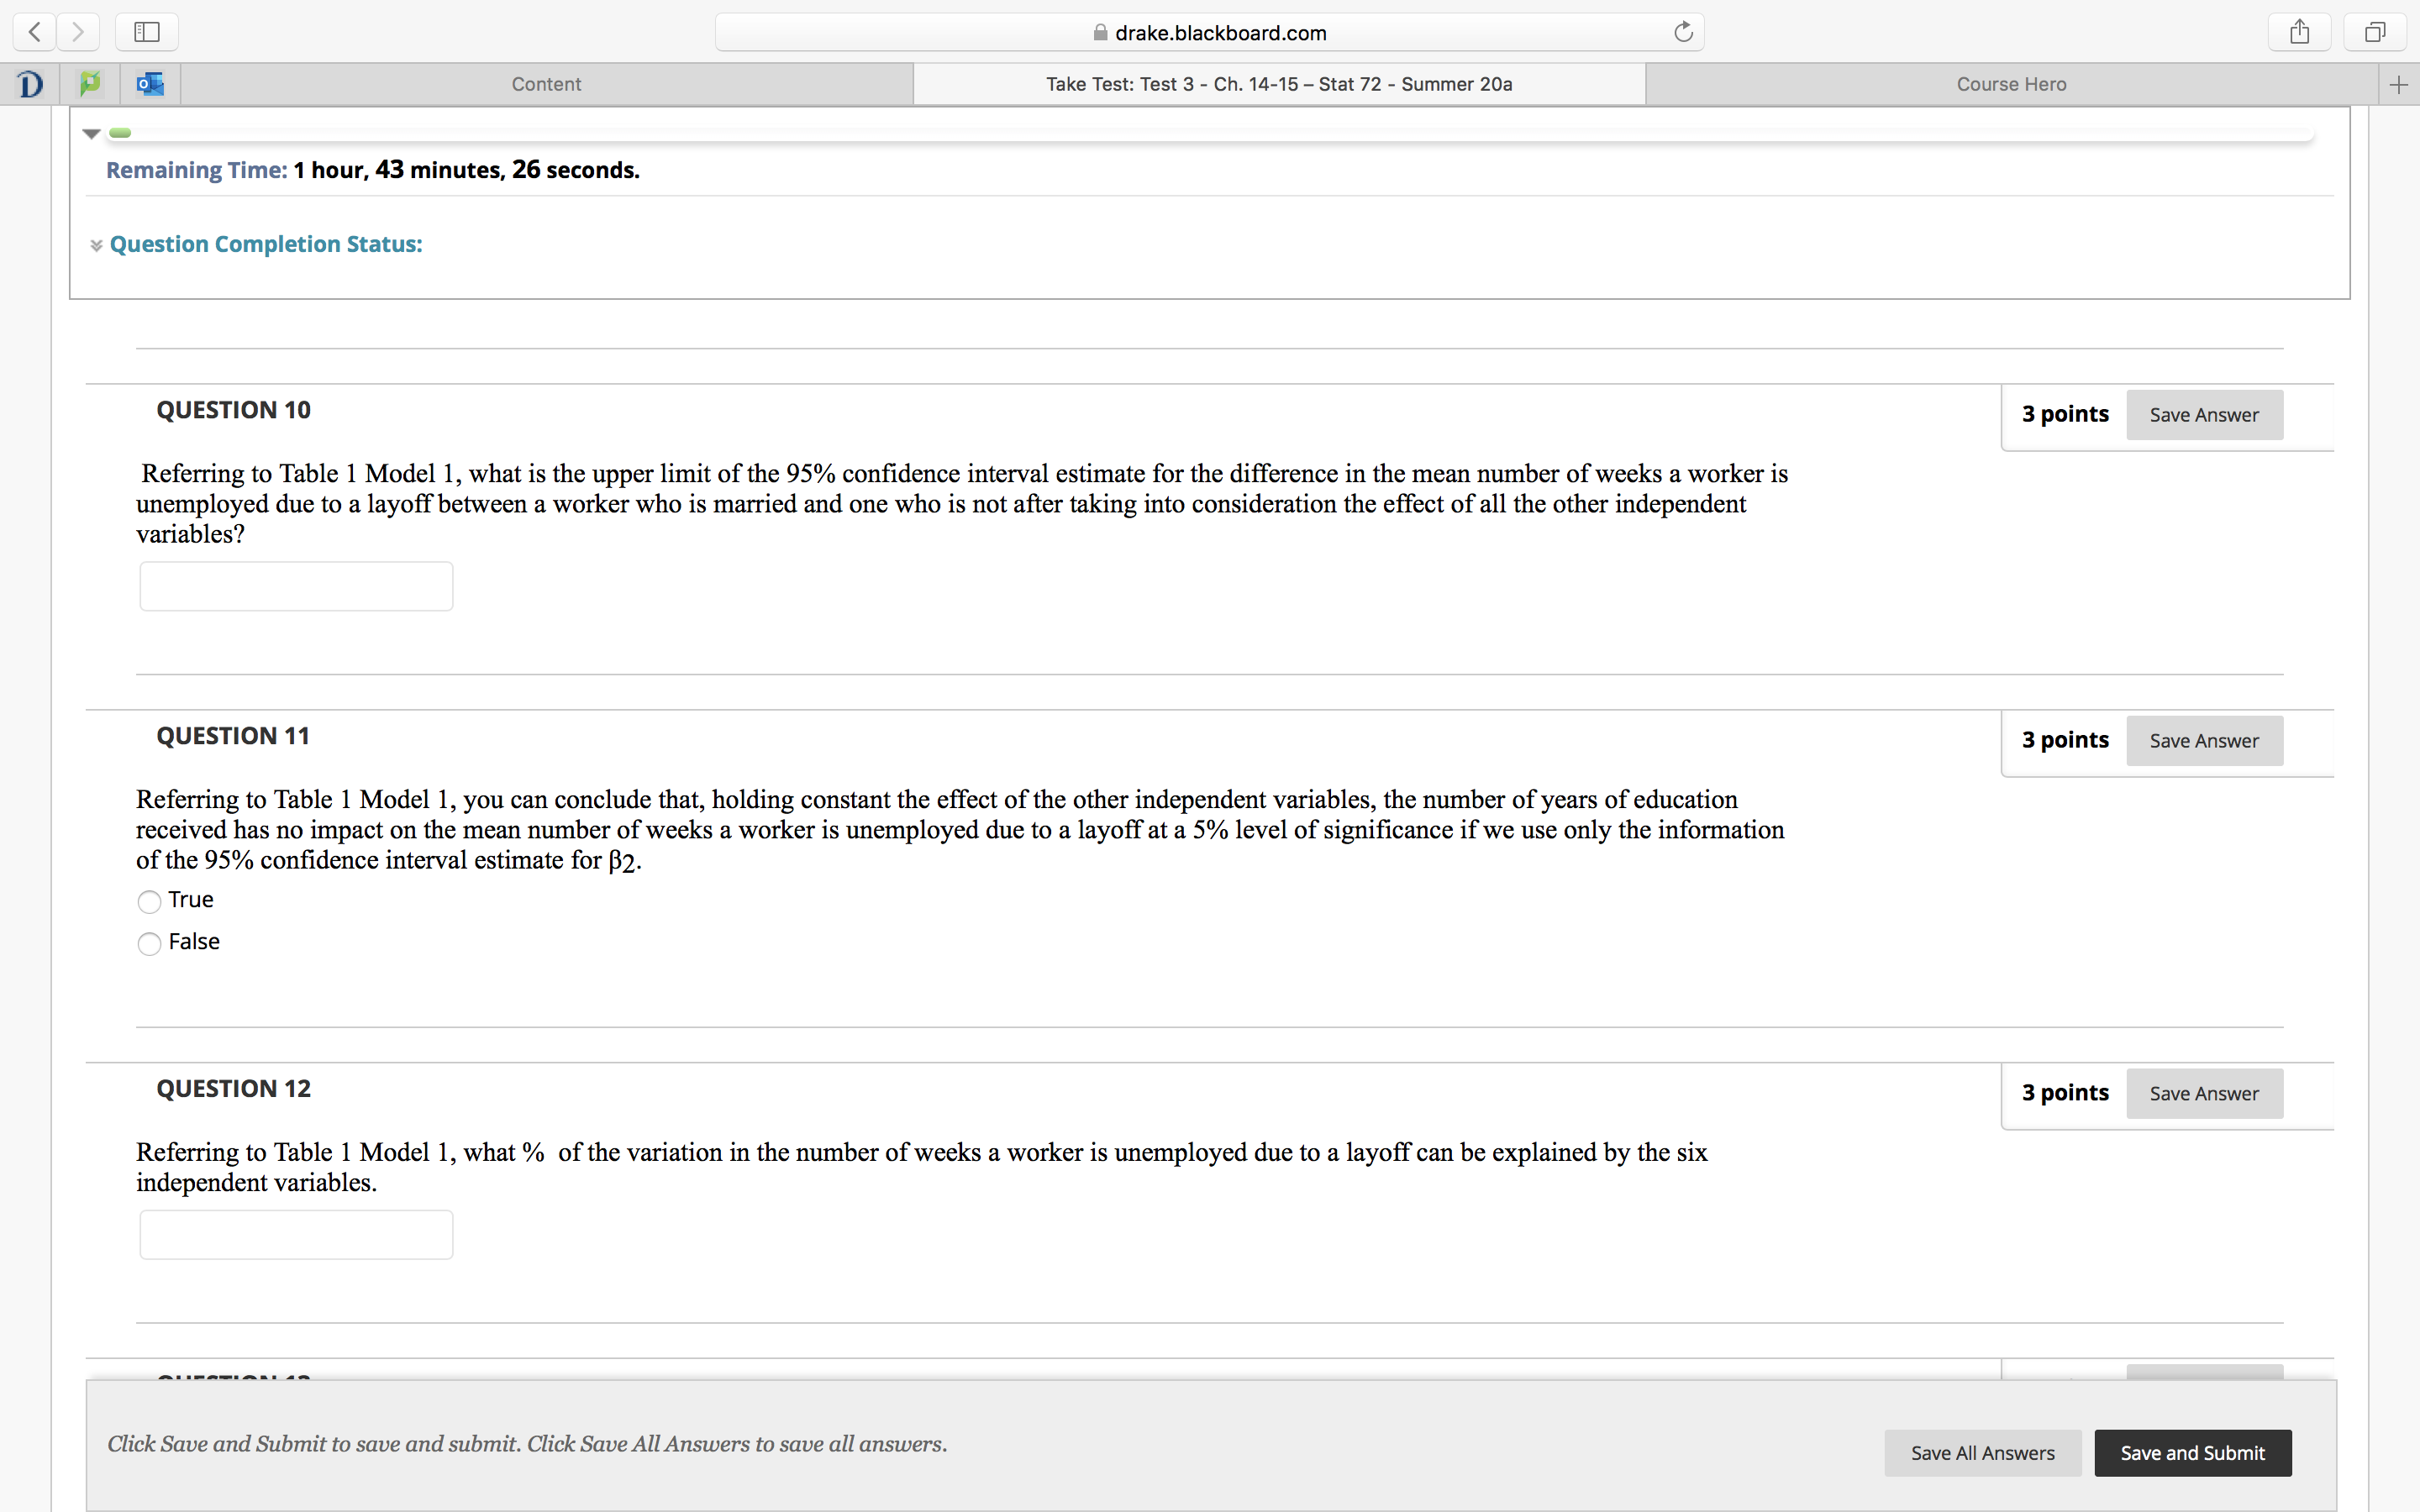
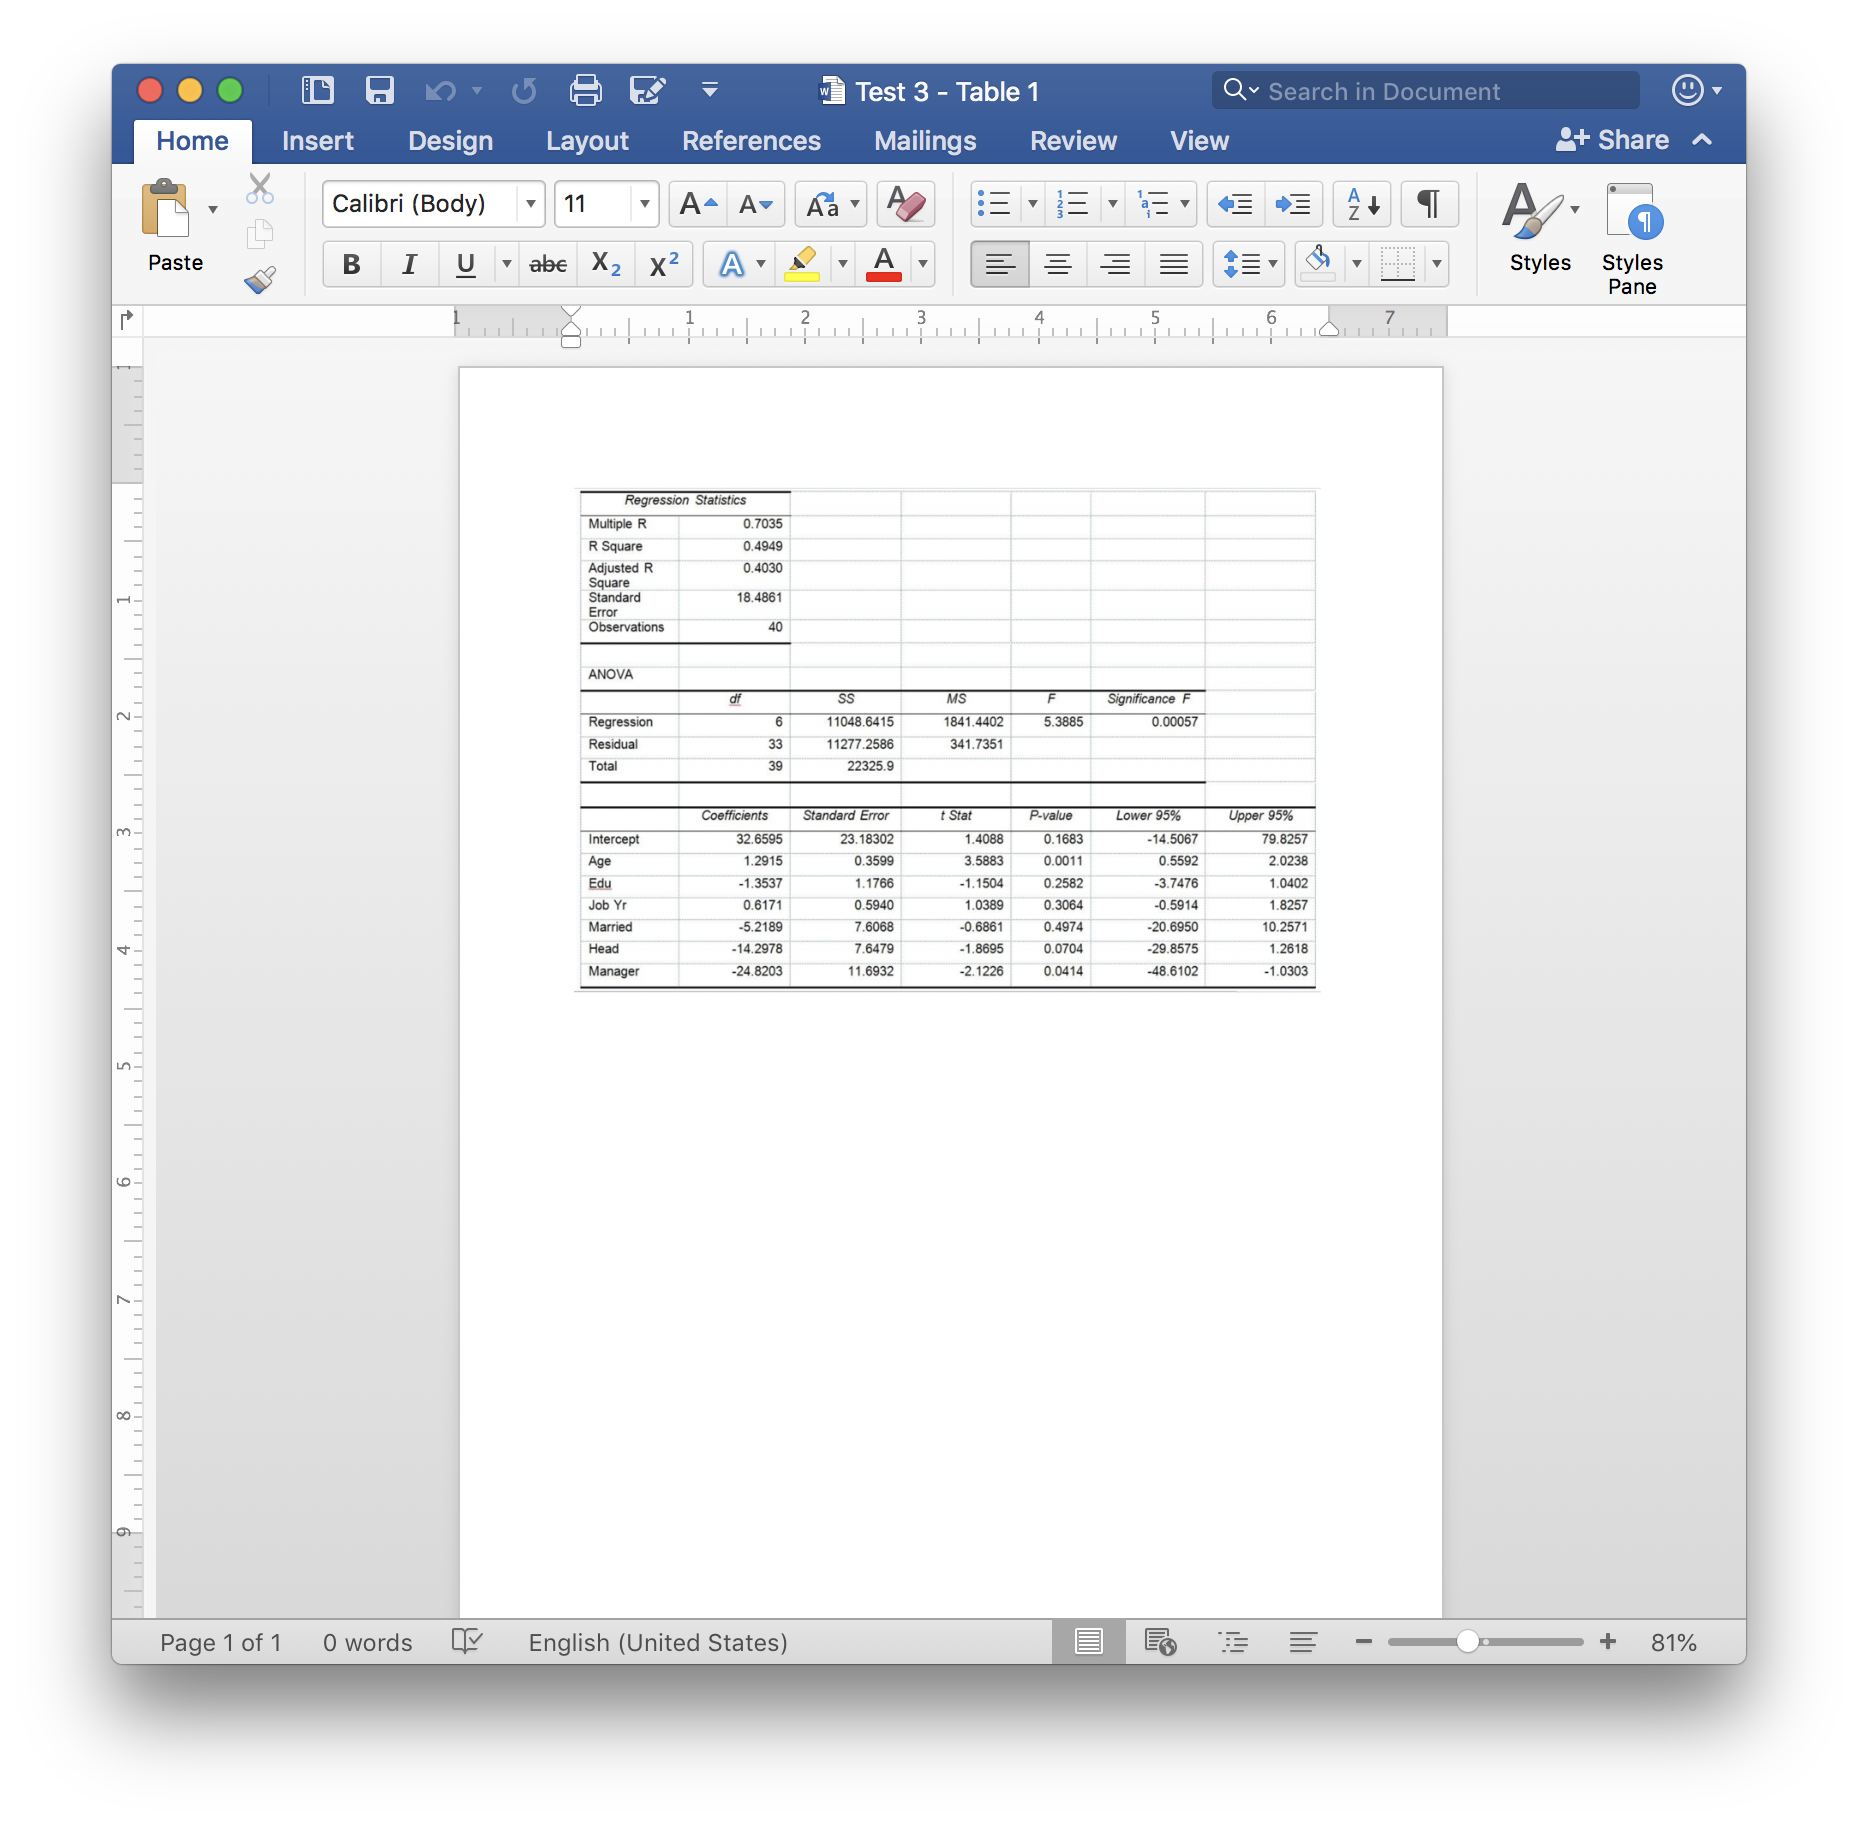
> H drakeblackboardcom C [I i 5' ' Content Take Test: Test 3 Ch. 14-15 Stat 72 - Summer 20a v .- Remaining Time: 1 hour. 43 minutes, 50 seconds. a Question Completion Status: Course Hero Given below are results om the regression analysis where the dependent variable is the number of weeks a worker is unemployed due to a layoff (Unemploy) and the independent variables are the age of the worker (Age), the number of years of education received (Edu), the number of years at the previous job (Job Yr), a dummy variable for marital status (Married: 1 = married, 0 = otherwise), a dummy variable for head of household (Head: 1 = yes, 0 : no) and a dummy variable for management position (Manager: 1 : yes, 0 : no). We shall call this Model 1. Test 3 - Table 1.docx Referring to Table 1 Model 1, which of the following is a correct statement? 'F 40.30% of the total variation in the number of weeks a worker is unemployed due to a layoff can be explained by the age of the worker, the number of years of education received, the number of years at the previous job, marital status, whether the worker is the head of household and whether the worker is a manager. 'F 40.30% of the total variation in the number of weeks a worker is unemployed due to a layoff can be explained by the age of the worker, the number of years of education received, the number of years at the previous job, marital status, whether the worker is the head of household and whether the worker is a manager, aer adjusting for the number of predictors and sample size. 'F 40.30% of the total variation in the number of weeks a worker is unemployed due to a layoff can be explained by the age of the worker, the number of years of education received, the number of years at the previous job, marital status, whether the worker is the head of household and whether the worker is a manager, aer adjusting for the level of signicance. A 40.30% of the total variation in the number of weeks a worker is unemployed due to a layoff can be explained by the age of the worker, the number of years of education received, the number of years at the previous job, marital status, whether the worker is the head of household and whether the worker is a manager, holding constant the effect of all the independent variables. QUESTION 2 Referring to Table 1 Model 1, predict the number of weeks being unemployed due to a layoff for a worker who is a thirty-year old, has 10 years of education, has 15 years of experience at the previous job, is married, is the head of household and is a manager. Click Save and Submit to save and submit. Click Save All Answers to save all answers. 4 polnts Save Answer Save All Answers Save and Submit drake.blackboard.com C D Content Take Test: Test 3 - Ch. 14-15 - Stat 72 - Summer 20a Course Hero + Remaining Time: 1 hour, 43 minutes, 43 seconds. Question Completion Status: QUESTION 3 3 points Save Answer Referring to Table 1 Model 1, what is the value of the test statistic when testing whether being married or not makes a difference in the mean number of weeks a worker is unemployed due to a layoff while holding constant the effect of all the other independent variables? QUESTION 4 3 points Save Answer Referring to Table 1 Model 1, what is the p-value of the test statistic when testing whether age has any effect on the number of weeks a worker is unemployed due to a layoff while holding constant the effect of all the other independent variables? QUESTION 5 3 points Save Answer Referring to Table 1 Model 1, the null hypothesis should be rejected at a 10% level of significance when testing whether age has any effect on the number of weeks a worker is unemployed due to a layoff. True O False QUESTION 6 3 points Save Answer Click Save and Submit to save and submit. Click Save All Answers to save all answers. Save All Answers Save and Submit drake.blackboard.com C D Content Take Test: Test 3 - Ch. 14-15 - Stat 72 - Summer 20a Course Hero + Remaining Time: 1 hour, 43 minutes, 36 seconds. Question Completion Status: QUESTION 6 3 points Save Answer Referring to Table 1 Model 1, which of the following is the correct null hypothesis to determine whether there is a significant relationship between the number of weeks a worker is unemployed due to a layoff and the entire set of explanatory variables? O HO: PO = B1 = B2 = B3 = B4 = B5 = 36 =0 O HO: B1 = B2 = B3 = 4 = 35 = 36 =0 O HO: BO = P1 = B2 = B3 = 4 = 35 = 36 O HO: B1 = B2 = B3 = 34 =15 = 16 QUESTION 7 3 points Save Answer Referring to Table 1 Model 1, the alternative hypothesis H1: At least one of Bj # 0 for j = 1, 2, 3, 4, 5, 6 implies that the number of weeks a worker is unemployed due to a layoff is related to all of the explanatory variables. True O False QUESTION 8 3 points Save Answer Referring to Table 1 Model 1, what is the value of the test statistic to determine whether there is a significant relationship between the number of weeks a worker is unemployed due to a layoff and the entire set of explanatory variables? Click Save and Submit to save and submit. Click Save All Answers to save all answers. Save All Answers Save and Submit drake.blackboard.com C D Content Take Test: Test 3 - Ch. 14-15 - Stat 72 - Summer 20a Course Hero + Remaining Time: 1 hour, 43 minutes, 31 seconds. Question Completion Status: QUESTION 9 3 points Save Answer Referring to Table 1 Model 1, there is sufficient evidence that at least one of the explanatory variables is related to the number of weeks a worker is unemployed due to a layoff at a 10% level of significance. True False QUESTION 10 3 points Save Answer Referring to Table 1 Model 1, what is the upper limit of the 95% confidence interval estimate for the difference in the mean number of weeks a worker is unemployed due to a layoff between a worker who is married and one who is not after taking into consideration the effect of all the other independent variables? QUESTION 11 3 points Save Answer Referring to Table 1 Model 1, you can conclude that, holding constant the effect of the other independent variables, the number of years of education received has no impact on the mean number of weeks a worker is unemployed due to a layoff at a 5% level of significance if we use only the information of the 95% confidence interval estimate for B2. True False QUESTION 12 3 points Save Answer Click Save and Submit to save and submit. Click Save All Answers to save all answers. Save All Answers Save and Submit drake.blackboard.com C D Content Take Test: Test 3 - Ch. 14-15 - Stat 72 - Summer 20a Course Hero + Remaining Time: 1 hour, 43 minutes, 26 seconds. Question Completion Status: QUESTION 10 3 points Save Answer Referring to Table 1 Model 1, what is the upper limit of the 95% confidence interval estimate for the difference in the mean number of weeks a worker is unemployed due to a layoff between a worker who is married and one who is not after taking into consideration the effect of all the other independent variables? QUESTION 11 3 points Save Answer Referring to Table 1 Model 1, you can conclude that, holding constant the effect of the other independent variables, the number of years of education received has no impact on the mean number of weeks a worker is unemployed due to a layoff at a 5% level of significance if we use only the information of the 95% confidence interval estimate for B2. True O False QUESTION 12 3 points Save Answer Referring to Table 1 Model 1, what % of the variation in the number of weeks a worker is unemployed due to a layoff can be explained by the six independent variables. Click Save and Submit to save and submit. Click Save All Answers to save all answers. Save All Answers Save and SubmitGE Test 3 - Table 1 Q Search in Document Home Insert Design Layout References Mailings Review View '+ Share Calibri (Body) * 11 A . Lo Past B I U . abE X2 X2 |A . L . A . = = = =13 .. Styles Styles Pane Regression Statistics Multiple R 0.7035 0.4949 Adjusted 0.4030 Standard 18.4861 Observations ANOVA MS Significance F Regression 11048.6415 1841.4402 5.3885 0.00057 Total 33 11277.2586 341 .735 22325.9 Coefficients Standard Error t Stat P-value Lower 95% Upper 95% tercept 32.6595 23 18302 1.4088 0. 1683 -14.5067 79 8257 Age 1.2915 0.3599 3.5883 0.0011 0.5592 2.0238 Edu -1.3537 1.1766 -1.1504 0.2582 -3.7476 Job Yr 0.6171 0.5940 1.0389 0.3064 -0.5914 1.8257 Married -5.2189 7.6068 -0.6861 0.4974 - 20.6950 10.2571 Head 14.2978 7.6479 1.8695 0.0704 29.8575 1.2618 Manager -24.8203 11.6932 -2. 1226 0.0414 -48.6102 -1.0303 Page 1 of 1 0 words English (United States) EO E + 81%
Step by Step Solution
There are 3 Steps involved in it

Get step-by-step solutions from verified subject matter experts