

Question: Please help me understand what what I did wrong and how to do it on excel. Questions under the numbers Thank you Studies have shown
Please help me understand what what I did wrong and how to do it on excel. Questions under the numbers
Thank you
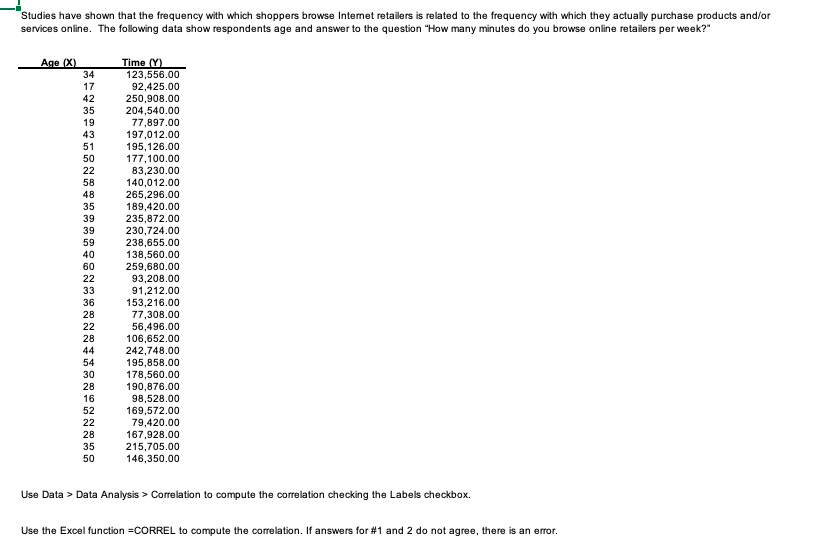
Studies have shown that the frequency with which shoppers browse Internet retailers is related to the frequency with which they actually purchase products and/or services online. The following data show respondents age and answer to the question "How many minutes do you browse online retailers per week?" Age (X) Time (Y) 34 123,556.00 17 92,425.00 42 250,908.00 35 204,540.00 19 77,897.00 43 197,012.00 51 195,126.00 50 177,100.00 22 83,230.00 58 140,012.00 48 265,296.00 35 189,420.00 39 235,872.00 39 230,724.00 59 238,655.00 40 138,560.00 60 259,680.00 22 93,208.00 33 91,212.00 36 153,216.00 28 77,308.00 22 56,496.00 28 106,652.00 44 242,748.00 54 195,858.00 30 178,560.00 28 190,876.00 16 98,528.00 52 169,572.00 22 79,420.00 28 167,928.00 35 215,705.00 50 146,350.00 Use Data > Data Analysis > Correlation to compute the correlation checking the Labels checkbox. Use the Excel function =CORREL to compute the correlation. If answers for #1 and 2 do not agree, there is an error
Step by Step Solution
There are 3 Steps involved in it

Get step-by-step solutions from verified subject matter experts