

Question: Please help me using this histogram McGraw-Hill -Connect Connect Sign In O & https://sicc.instructure.com/courses/741972/assignments/9742686 Part III should include: A. Find a stemplot, dotplot, or histogram

Please help me using this histogram
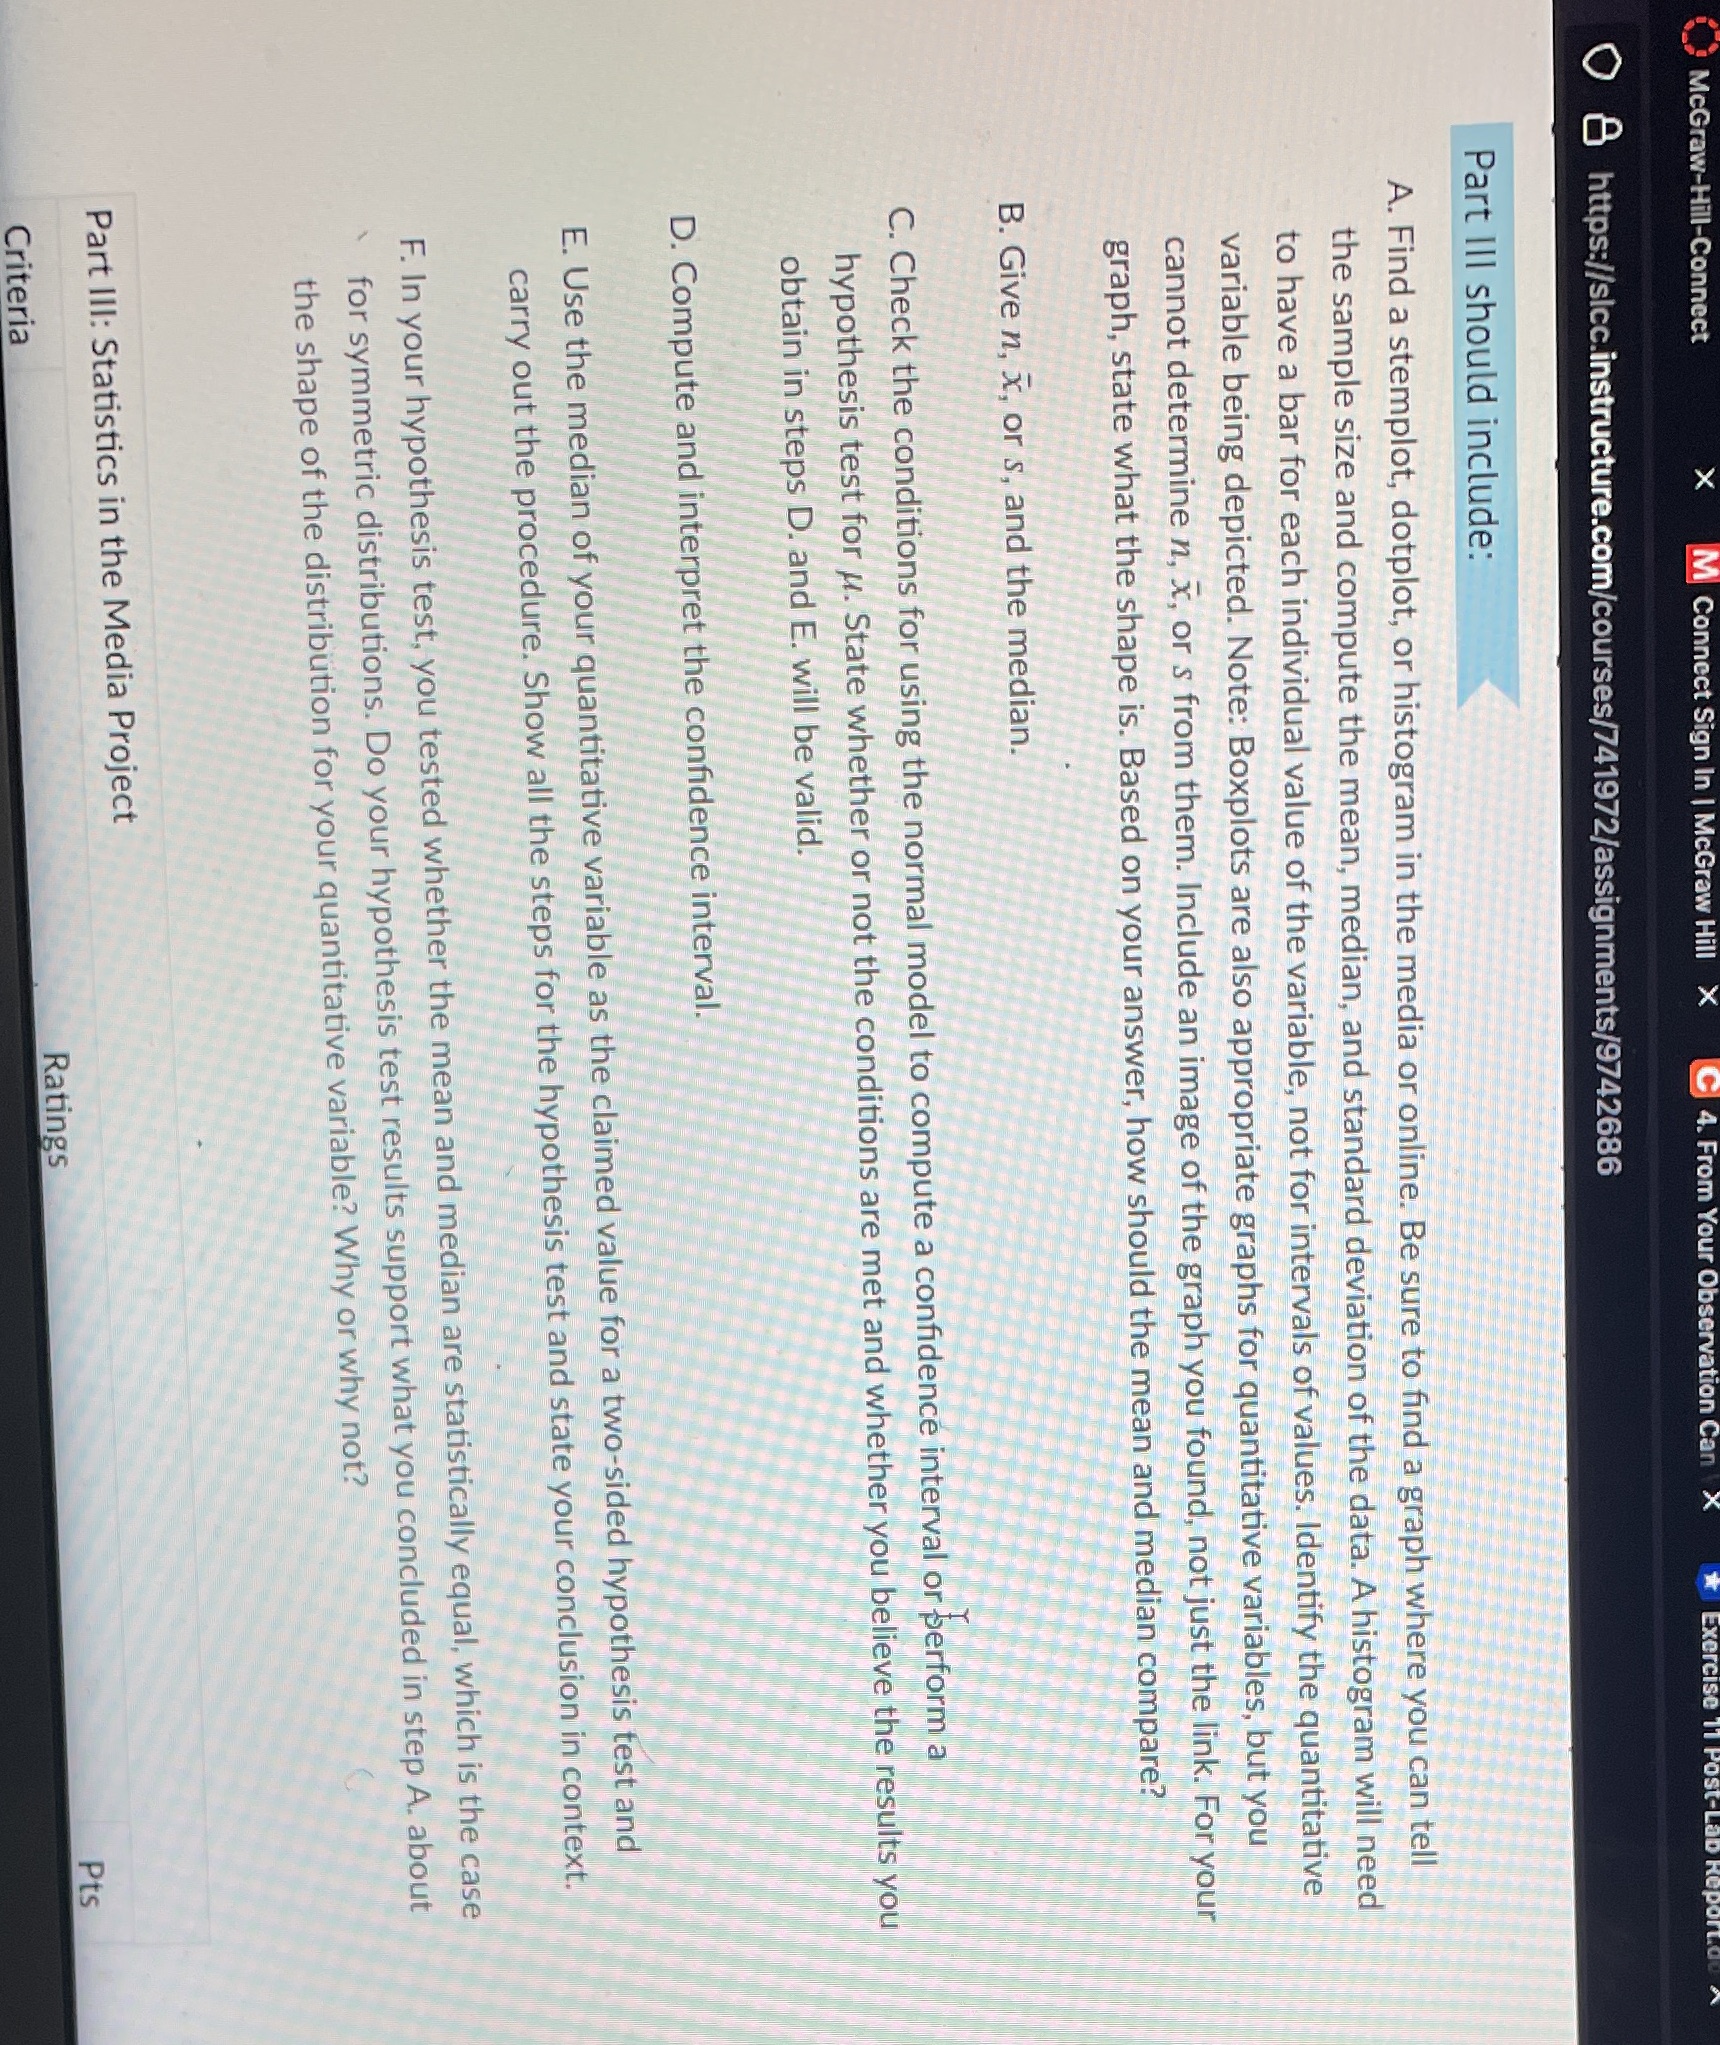
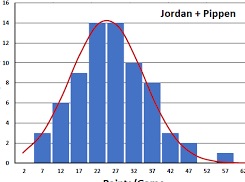
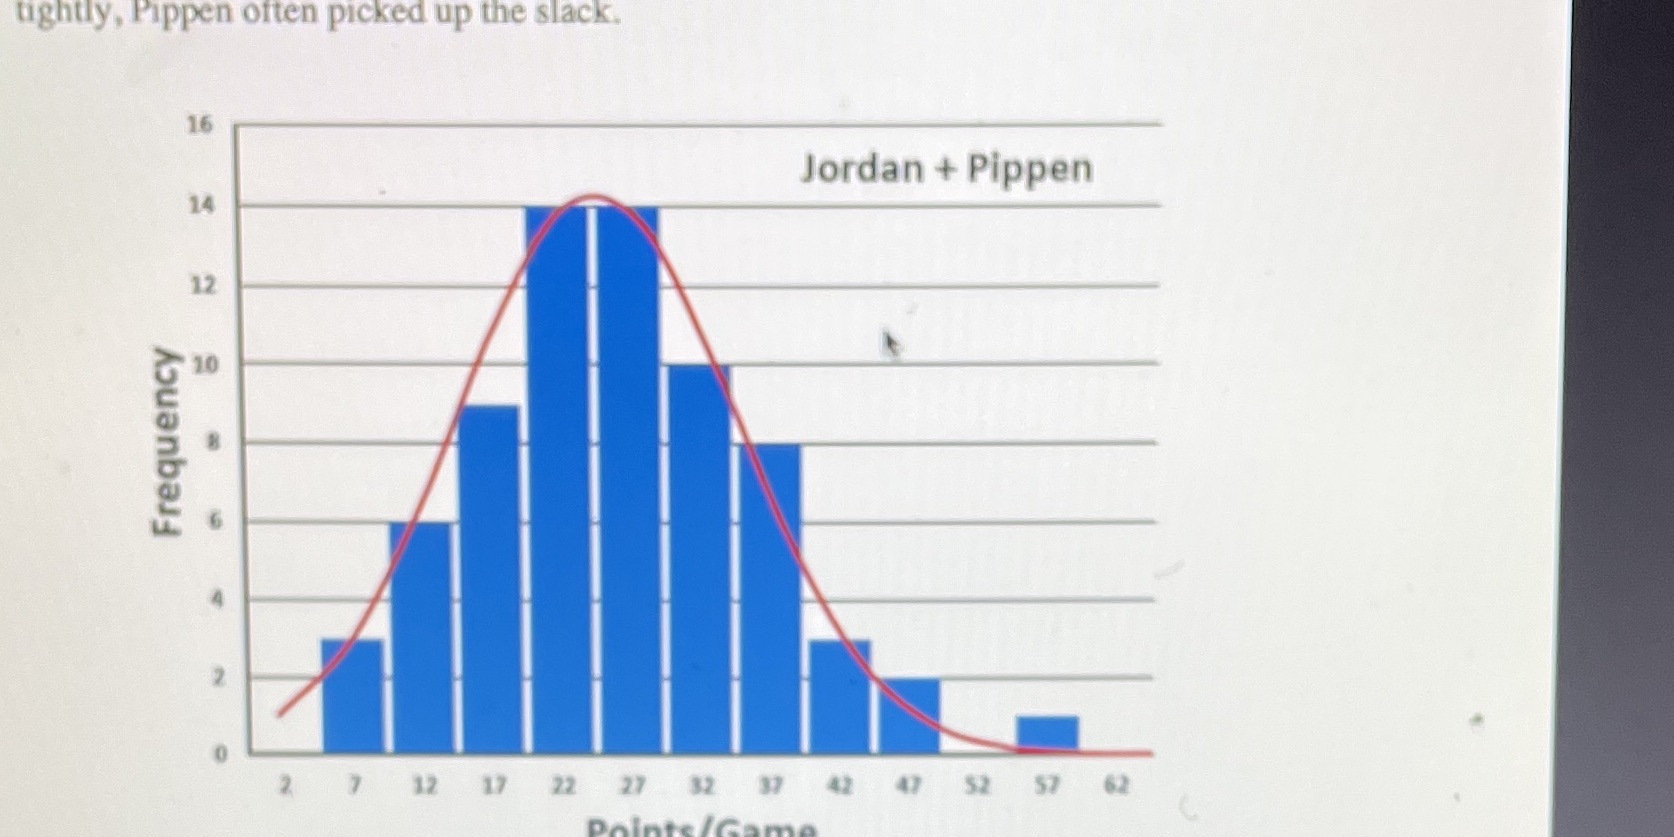
McGraw-Hill -Connect Connect Sign In O & https://sicc.instructure.com/courses/741972/assignments/9742686 Part III should include: A. Find a stemplot, dotplot, or histogram in the media or online. Be sure to find a graph where you can tell the sample size and compute the mean, median, and standard deviation of the data. A histogram will need to have a bar for each individual value of the variable, not for intervals of values. Identify the quantitative variable being depicted. Note: Boxplots are also appropriate graphs for quantitative variables, but you cannot determine n, x, or s from them. Include an image of the graph you found, not just the link. For your graph, state what the shape is. Based on your answer, how should the mean and median compare? B. Give n, x, or s, and the median. C. Check the conditions for using the normal model to compute a confidence interval or perform a hypothesis test for u. State whether or not the conditions are met and whether you believe the results you obtain in steps D. and E. will be valid. D. Compute and interpret the confidence interval. E. Use the median of your quantitative variable as the claimed value for a two-sided hypothesis test and carry out the procedure. Show all the steps for the hypothesis test and state your conclusion in context. F. In your hypothesis test, you tested whether the mean and median are statistically equal, which is the case for symmetric distributions. Do your hypothesis test results support what you concluded in step A. about the shape of the distribution for your quantitative variable? Why or why not? Part III: Statistics in the Media Project Criteria Ratings PtsJordan + Pippen 12 10 17 ATtightly, Pippen often picked up the slack. 16 Jordan + Pippen 14 12 10 Frequency 2 7 12 17 22 27 32 37 42 52 57 62 Pointe/Can
Step by Step Solution
There are 3 Steps involved in it

Get step-by-step solutions from verified subject matter experts