

Question: please help me with a and b + Ft to page Pageview | A Read aloud Add notes 15-12 Current assets Fixed assets Total 2011
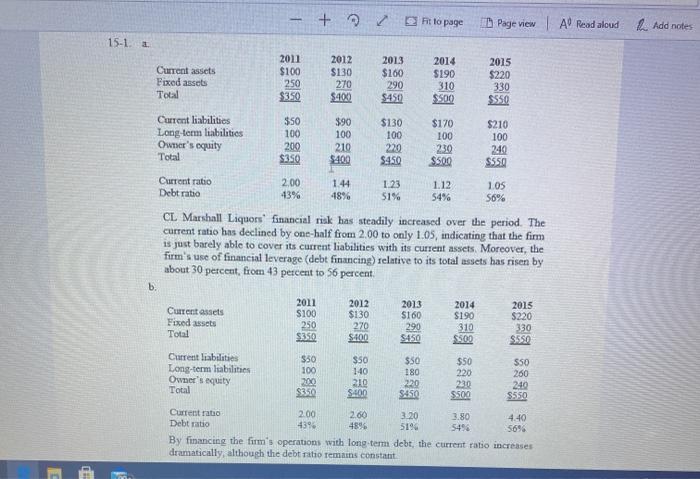
+ Ft to page Pageview | A Read aloud Add notes 15-12 Current assets Fixed assets Total 2011 $100 250 $350 2012 $130 270 $400 2013 $160 290 $450 2014 $190 310 $500 2015 $220 330 $550 Current liabilities Long-term liabilities Owner's equity Total $50 100 200 $350 390 100 210 $400 $130 100 220 $450 $170 100 230 $500 $210 100 240 SSSO Current ratio Debt ratio 2.00 43% 1.44 48% 1.23 51% 1.12 54% 105 56% CL Marshall Liquors' financial risk has steadily increased over the period. The current ratio has declined by one-half from 2.00 to only 1.05, indicating that the firm is just barely able to cover its current liabilities with its current assets. Moreover, the firm's use of financial leverage (debt financing) relative to its total assets has risen by about 30 percent, from 43 percent to 56 percent b. Current assets Fixed assets Total 2011 $100 250 $350 2012 $130 270 $400 2013 $160 290 S450 2014 $190 310 S50D 2015 $220 330 S550 Current liabilities Long-term liabilities Owner's but Total $50 100 20 $350 $50 140 210 $50 180 220 S450 $50 220 23.0 $500 SSO 260 240 $550 S-400 Current ratio 2.00 2.60 3.20 3.80 4.40 Debt ratio 439 4896 51% 5493 569 By financing the firm's operations with long-term debt, the current ratio increases dramatically, although the debt ratio remains constant + Ft to page Pageview | A Read aloud Add notes 15-12 Current assets Fixed assets Total 2011 $100 250 $350 2012 $130 270 $400 2013 $160 290 $450 2014 $190 310 $500 2015 $220 330 $550 Current liabilities Long-term liabilities Owner's equity Total $50 100 200 $350 390 100 210 $400 $130 100 220 $450 $170 100 230 $500 $210 100 240 SSSO Current ratio Debt ratio 2.00 43% 1.44 48% 1.23 51% 1.12 54% 105 56% CL Marshall Liquors' financial risk has steadily increased over the period. The current ratio has declined by one-half from 2.00 to only 1.05, indicating that the firm is just barely able to cover its current liabilities with its current assets. Moreover, the firm's use of financial leverage (debt financing) relative to its total assets has risen by about 30 percent, from 43 percent to 56 percent b. Current assets Fixed assets Total 2011 $100 250 $350 2012 $130 270 $400 2013 $160 290 S450 2014 $190 310 S50D 2015 $220 330 S550 Current liabilities Long-term liabilities Owner's but Total $50 100 20 $350 $50 140 210 $50 180 220 S450 $50 220 23.0 $500 SSO 260 240 $550 S-400 Current ratio 2.00 2.60 3.20 3.80 4.40 Debt ratio 439 4896 51% 5493 569 By financing the firm's operations with long-term debt, the current ratio increases dramatically, although the debt ratio remains constant
Step by Step Solution
There are 3 Steps involved in it

Get step-by-step solutions from verified subject matter experts