Question: Please help me with an question on Intellectual Asset Valuation: What is the industry average for contribution to profit from intellectual property and intellectual assets
Please help me with an question on Intellectual Asset Valuation:
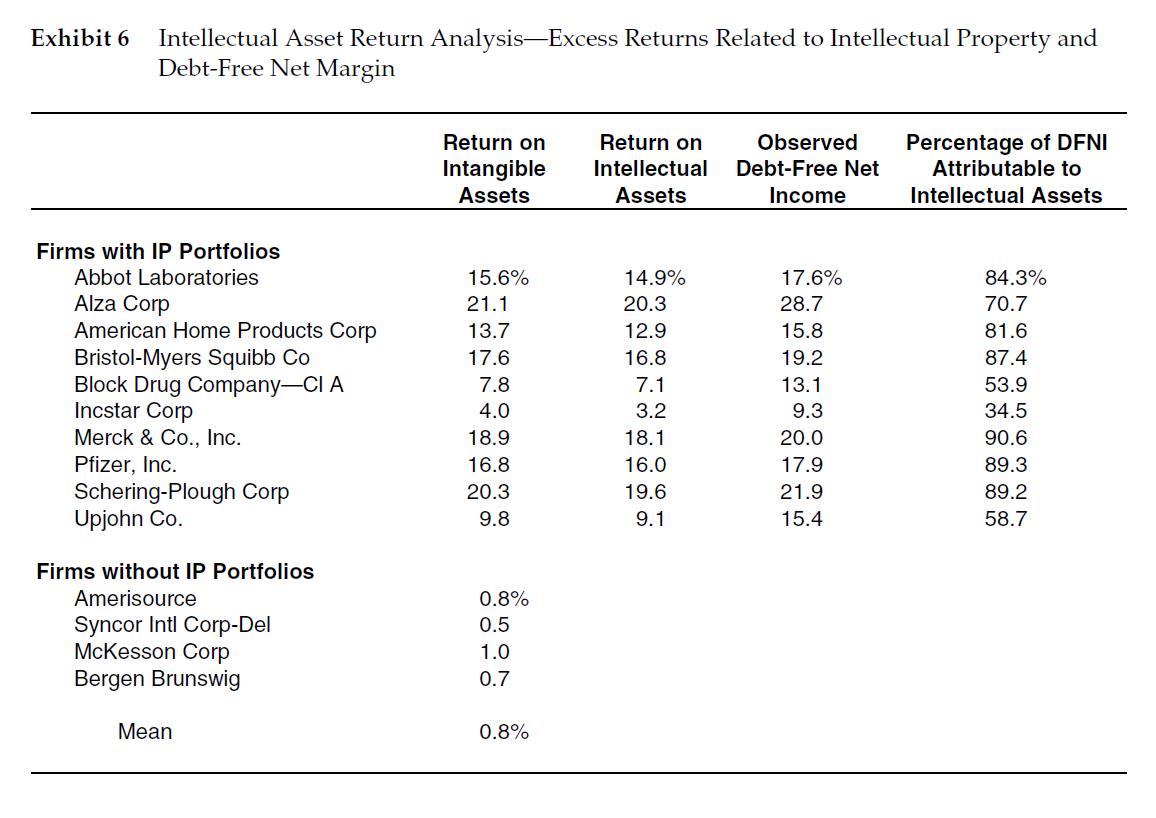
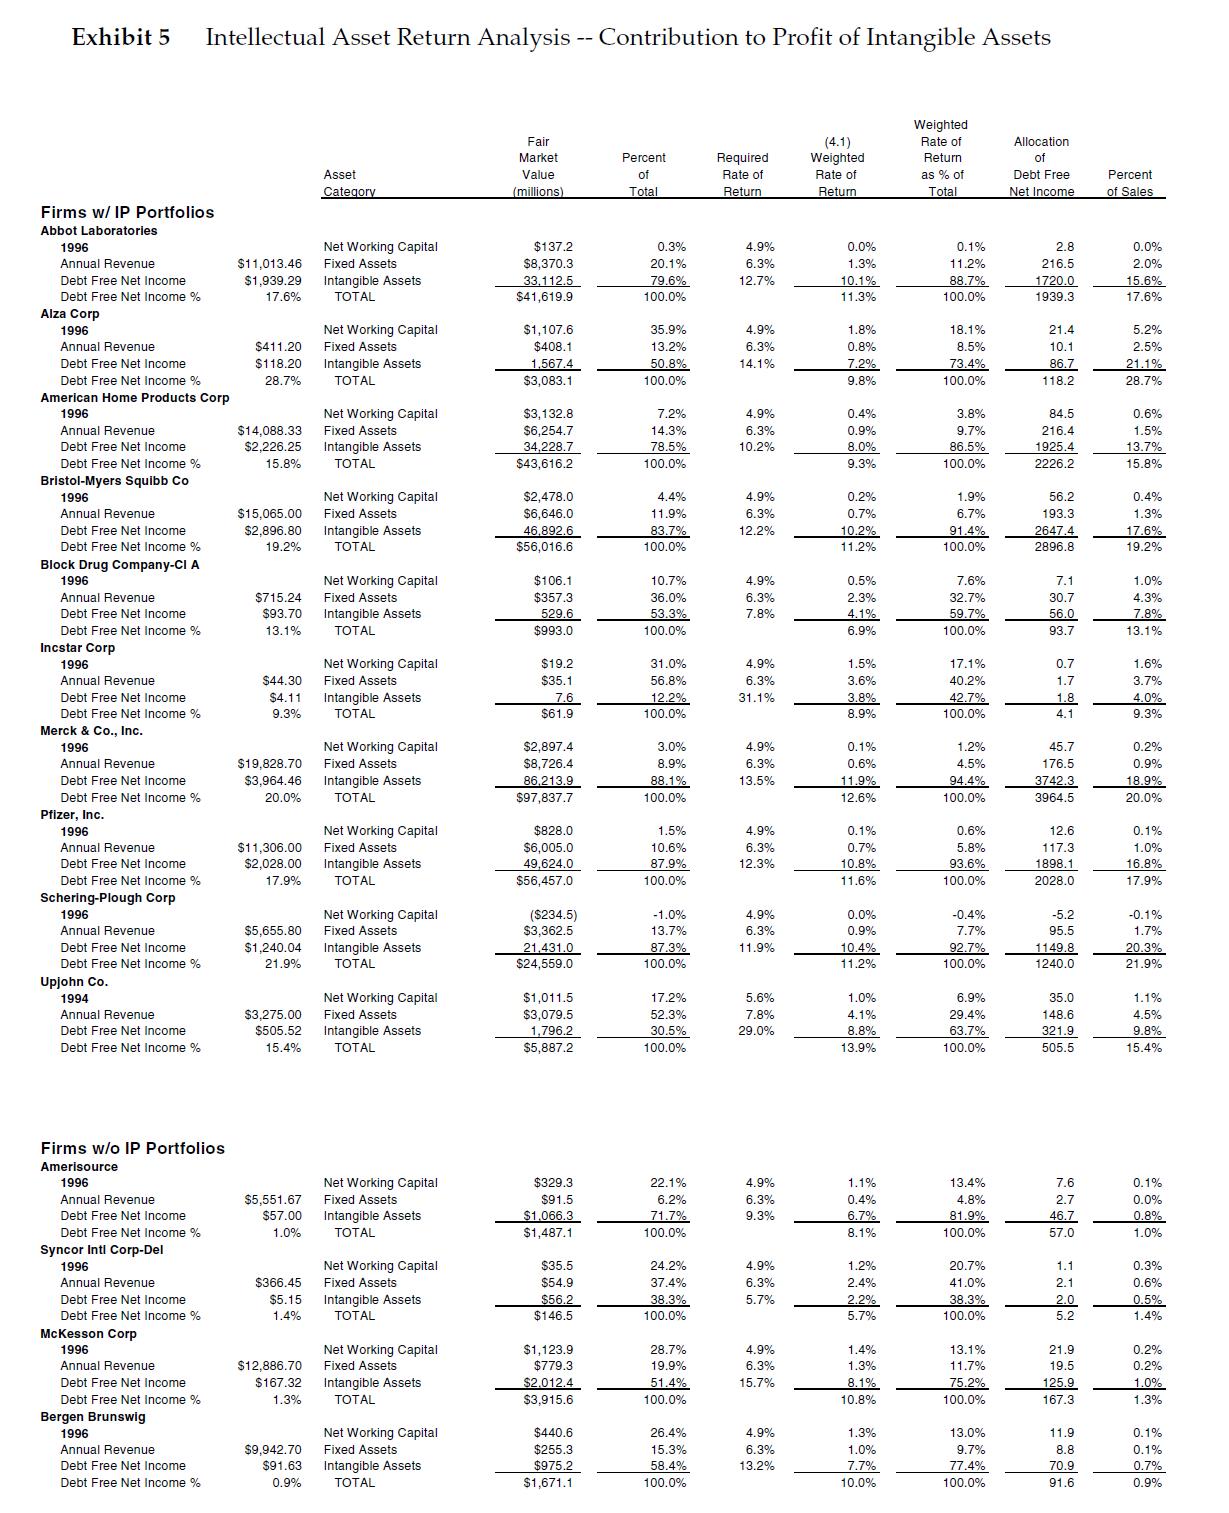
What is the industry average for contribution to profit from intellectual property and intellectual assets (CPIPIA)?
Exhibit 6 Intellectual Asset Return Analysis-Excess Returns Related to Intellectual Property and Debt-Free Net Margin Return on Return on Observed Percentage of DFNI Intangible Intellectual Debt-Free Net Attributable to Assets Assets Income Intellectual Assets Firms with IP Portfolios Abbot Laboratories 15.6% 14.9% 17.6% 84.3% Alza Corp 21.1 20.3 28.7 70.7 American Home Products Corp 13.7 12.9 15.8 81.6 Bristol-Myers Squibb Co 17.6 16.8 19.2 87.4 Block Drug Company-CI A 7.8 7.1 13.1 53.9 Incstar Corp 4.0 3.2 9.3 34.5 Merck & Co., Inc. 18.9 18.1 20.0 90.6 Pfizer, Inc. 16.8 16.0 17.9 89.3 Schering-Plough Corp 20.3 19.6 21.9 89.2 Upjohn Co. 9.8 9.1 15.4 58.7 Firms without IP Portfolios Amerisource 0.8% Syncor Intl Corp-Del 0.5 Mckesson Corp 1.0 Bergen Brunswig 0.7 Mean 0.8%Exhibit 5 Intellectual Asset Return Analysis -- Contribution to Profit of Intangible Assets Weighted Market Required Weighted Return Asset Rate o Percent (millions) Total Return Return Total Firms w/ IP Portfolios Abbot Laboratories 2.8 0.0% 1996 0.3% 11.2% 216.5 2.0% Annual Revenue $11,013.46 $8,370.3 6.3% 1.3% Intangible Assets 33.112.5 12.7% 15.6% TOTAL 1939.3 17.6% Alza Corp 1996 Net Working Capital $1, 107.6 35.9% 4.9% 1.8% 18.1% 5.2% Annual Revenue Fixed Assets 13.2% 6.3% 0.8% 28.7% Debt Free Net Income % 28 7% TOTAL $3,083.1 00.0% 9.8% 100.0% American Home Products Corp Net Working Capital $3, 132.8 4.9% 0.4% 3.8% 84.5 0.6% $6,254.7 14.3% 6.3% 0.9% 9.7% 216.4 Debt Free Net Income $2,226.25 34,228.7 78.5% 10.2% 8.0% 86.59 1925.4 13.7% 15.8% Debt Free Net Income 9% TOTAL $43,616.2 2226.2 Net Working Capital $2,478.0 4.9% 0.2% 56.2 0.4% 1996 4.4% $15,065.00 $6,646.0 0.7% 93.3 Debt Free Net Income $2.896.80 46.892.6 10.2% 91.4% 7.6% Block Drug Company-CI A 1996 Net Working Capital 4.9% 7.6% $715.24 $357.3 36.0% 6.3% 2.3% $93.70 Intangible Assets 529.6 7.8% 56.0 13.1% Incstar Corp 4.9% Annual Revenue $35.1 6.3% 3.6% 40.20 3.7% 31.1% 1.8 9.3% TOTAL $61.9 100.0% 8.9% Merck & Co., Inc. $2,897.4 0.1% 0.2% 1996 Net Working Capital 3.0% 4.9% $8,726.4 8.9% 6.3% 176.5 0.9% Annual Revenue 13.5% 18.9% TOTAL $97,837.7 100.0% 3964.5 20.0% Debt Free Net Income % 12.6% 12.6 0. 1% 1996 Net Working Capital $828.0 1.5% 4.9% 0.1% 0.7% 5.8% 17.3 16.8% Debt Free Net Income $2,028.00 49,624.0 12.3% 93.6% TOTAL $56,457.0 100.0% 1028.0 17.9% Debt Free Net Income % 0.1% 1996 Net Working Capital ($234.5) 4.9% 0.0% -0.4% -5.2 $5,655.80 Fixed Assets $3,362.5 13.7% 0.9% 95.5 Debt Free Net Income $1,240.04 21.431.0 10.4% 92.7% 20.3% Upjohn Co. 5.6% 1.1% 1994 $3,275.00 $3,079.5 52.3% 7.8% 4.1% 29.4% 148.6 4.5% $505.52 Intangible Assets 1,796.2 30.5% 8.8% 321.9 9.8% TOTAL Firms w/o IP Portfolios 1996 Net Working Capital $329.3 4.9% 1.1% 7.6 0.1% Fixed Assets 6.3% 0.8% Debt Free Net Income $57.00 71.7% 9.3% 6.7% 46.7 Debt Free Net Income % 1.0% 8.1% $35.5 4.9% 20.7% 0.3% 54.9 37.4% 41.09 0.6% Debt Free Net Income $5.15 5.7% 2.2% 38.3% 2.0 0.5% Mckesson Corp 1996 Net Working Capital 3.1% 21.9 1.3% Annual Revenue Fixed Assets 19.9% 19.5 $12,886.70 $779.3 6.3% $167.32 Intangible Assets 51.4% 15.7% 25.9 10.8% 100.0% 67.3 Bergen Brunswig $440.6 26.4% 11.9 0.1% Annual Revenue $9,942.70 Fixed Assets $255.3 15.3% 6.3% 1.0% 9.7% 8.8 0.1% 70.9 TOTAL $1,671.1 91.6 0.9% Debt Free Net Income % 0.9% 100.0% 10.0%