

Question: Please help me with both tables and questions 36-38 please show work so I can understand thank you!! 2 10 student regular MBA programs. Eighty
Please help me with both tables and questions 36-38 please show work so I can understand thank you!!
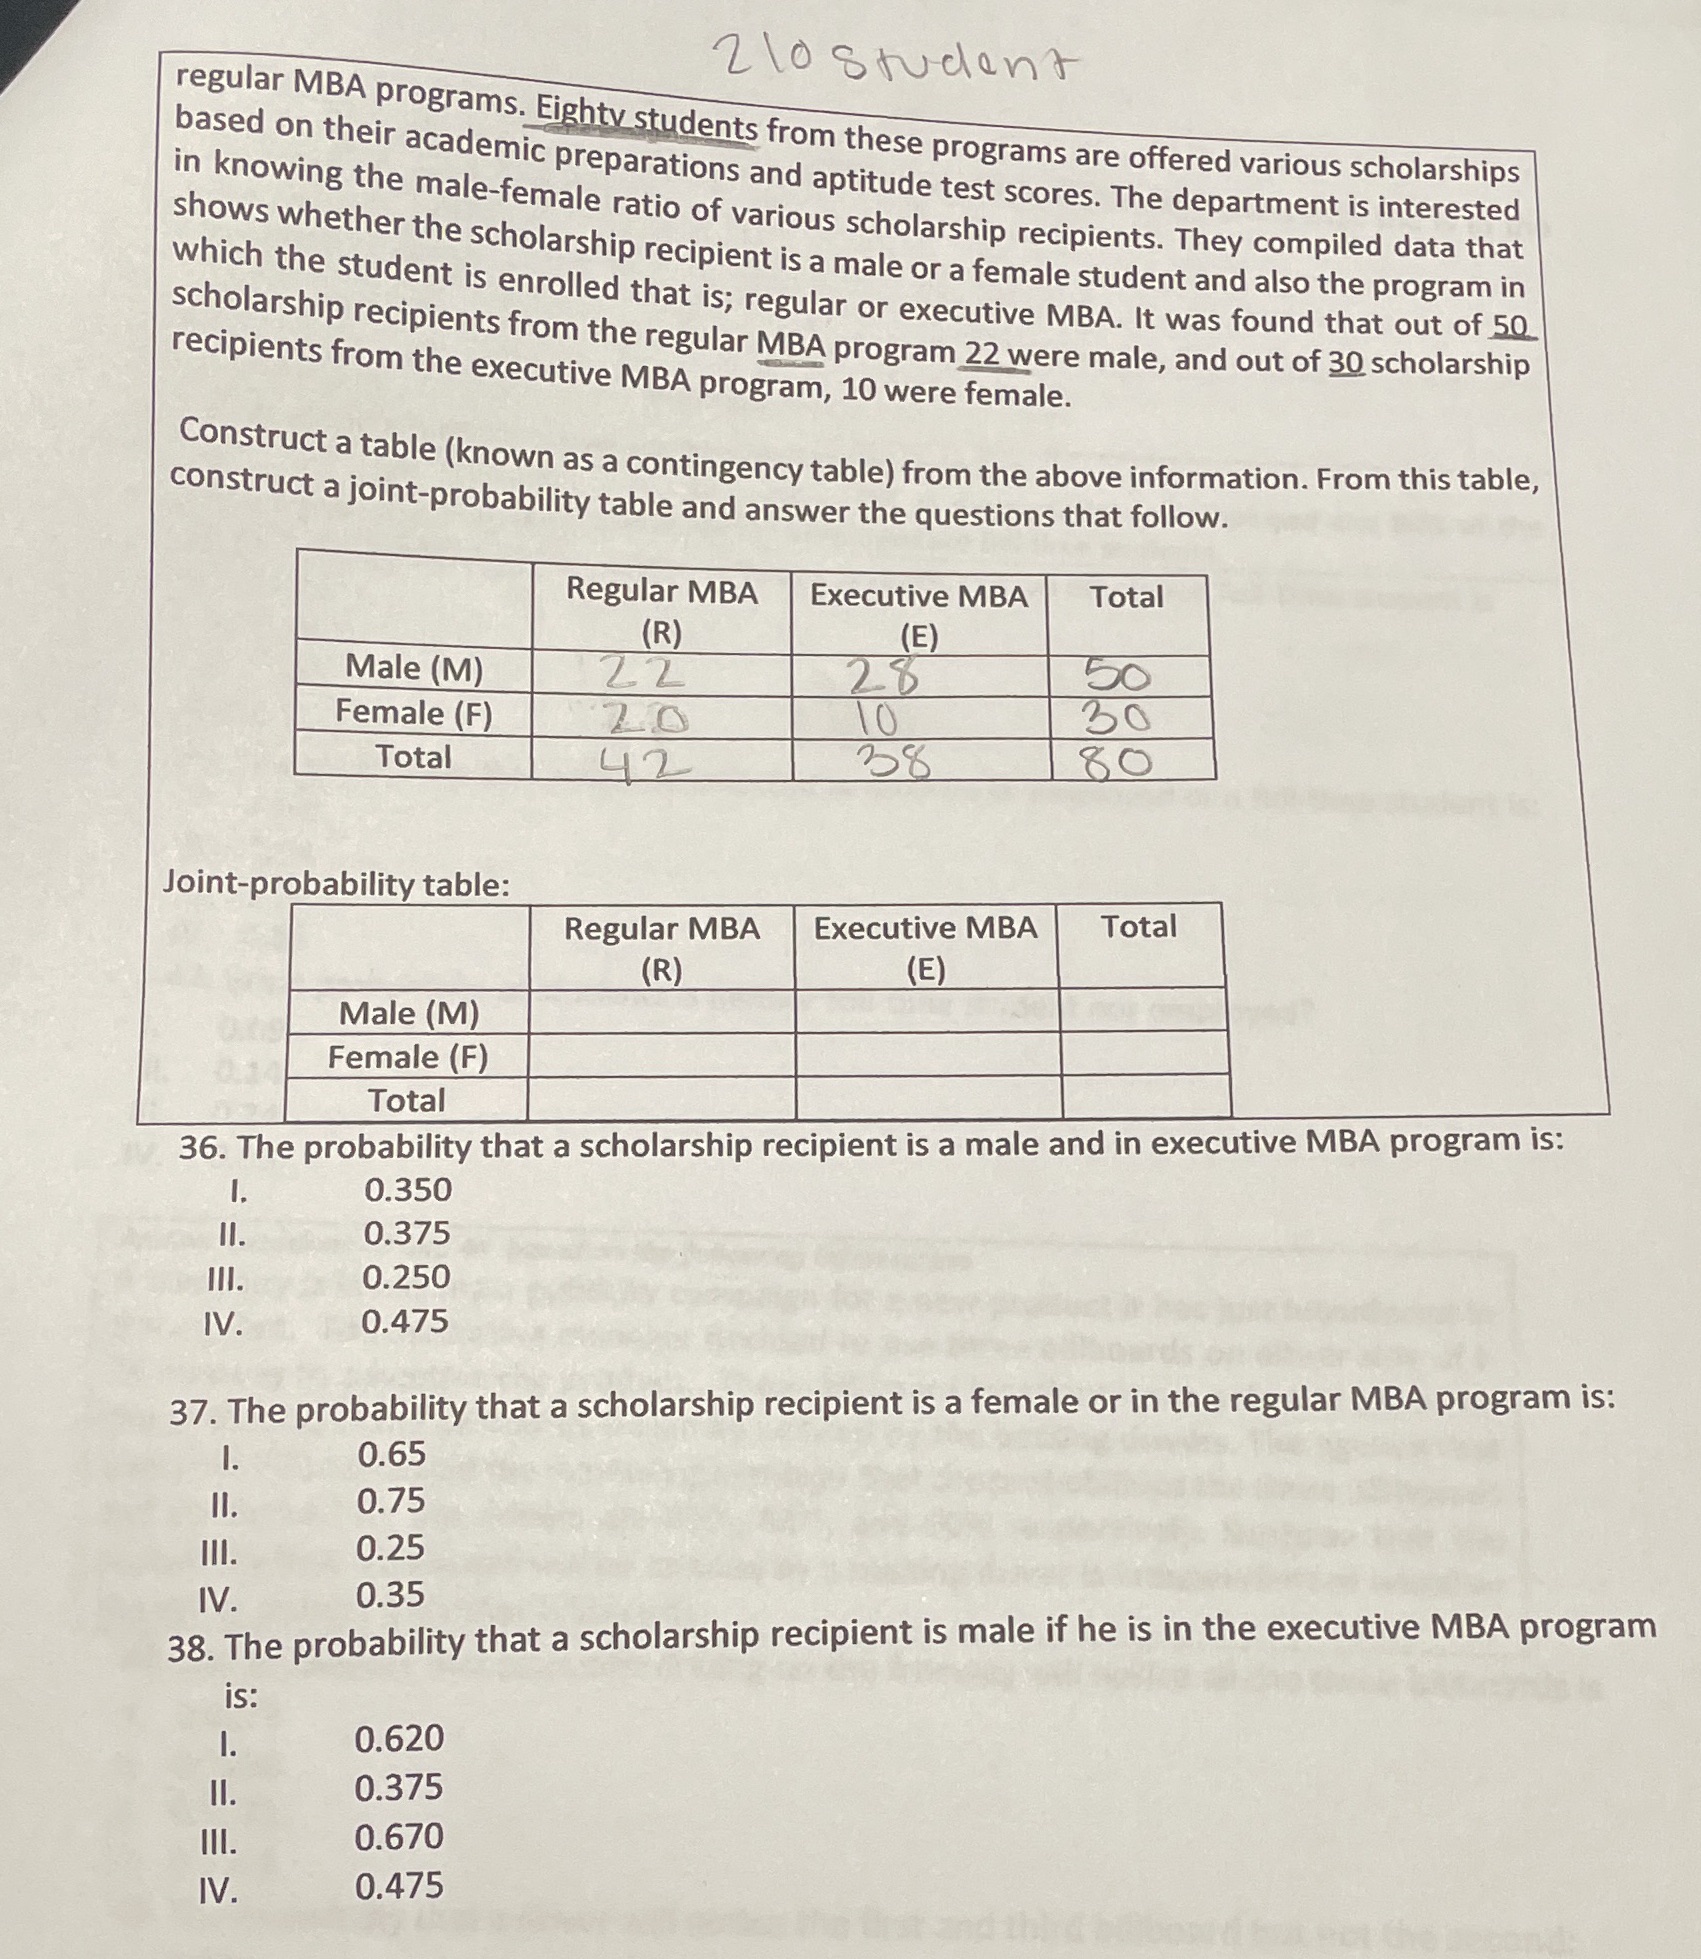
2 10 student regular MBA programs. Eighty students from these programs are offered various scholarships based on their academic preparations and aptitude test scores. The department is interested in knowing the male-female ratio of various scholarship recipients. They compiled data that shows whether the scholarship recipient is a male or a female student and also the program in which the student is enrolled that is; regular or executive MBA. It was found that out of 50 scholarship recipients from the regular MBA program 22 were male, and out of 30 scholarship recipients from the executive MBA program, 10 were female. Construct a table (known as a contingency table) from the above information. From this table, construct a joint-probability table and answer the questions that follow. Regular MBA Executive MBA Total (R) (E) Male (M) 22 28 50 Female (F) 20 30 Total 42 38 80 Joint-probability table: Regular MBA Executive MBA Total (R (E) Male (M) Female (F) Total 36. The probability that a scholarship recipient is a male and in executive MBA program is: 0.350 I1. 0.375 III. 0.250 IV. 0.475 37. The probability that a scholarship recipient is a female or in the regular MBA program is: 1. 0.65 II. 0.75 0.25 IV. 0.35 38. The probability that a scholarship recipient is male if he is in the executive MBA program is: 1. 0.620 I1. 0.375 0.670 IV. 0.475
Step by Step Solution
There are 3 Steps involved in it

Get step-by-step solutions from verified subject matter experts