

Question: Please help me with explanations. G ng.cengage.com C Project 7: Expectation Theory - LBUS 201 OL Principles of Eco... Mind Tap - Cengage Learning The
Please help me with explanations.
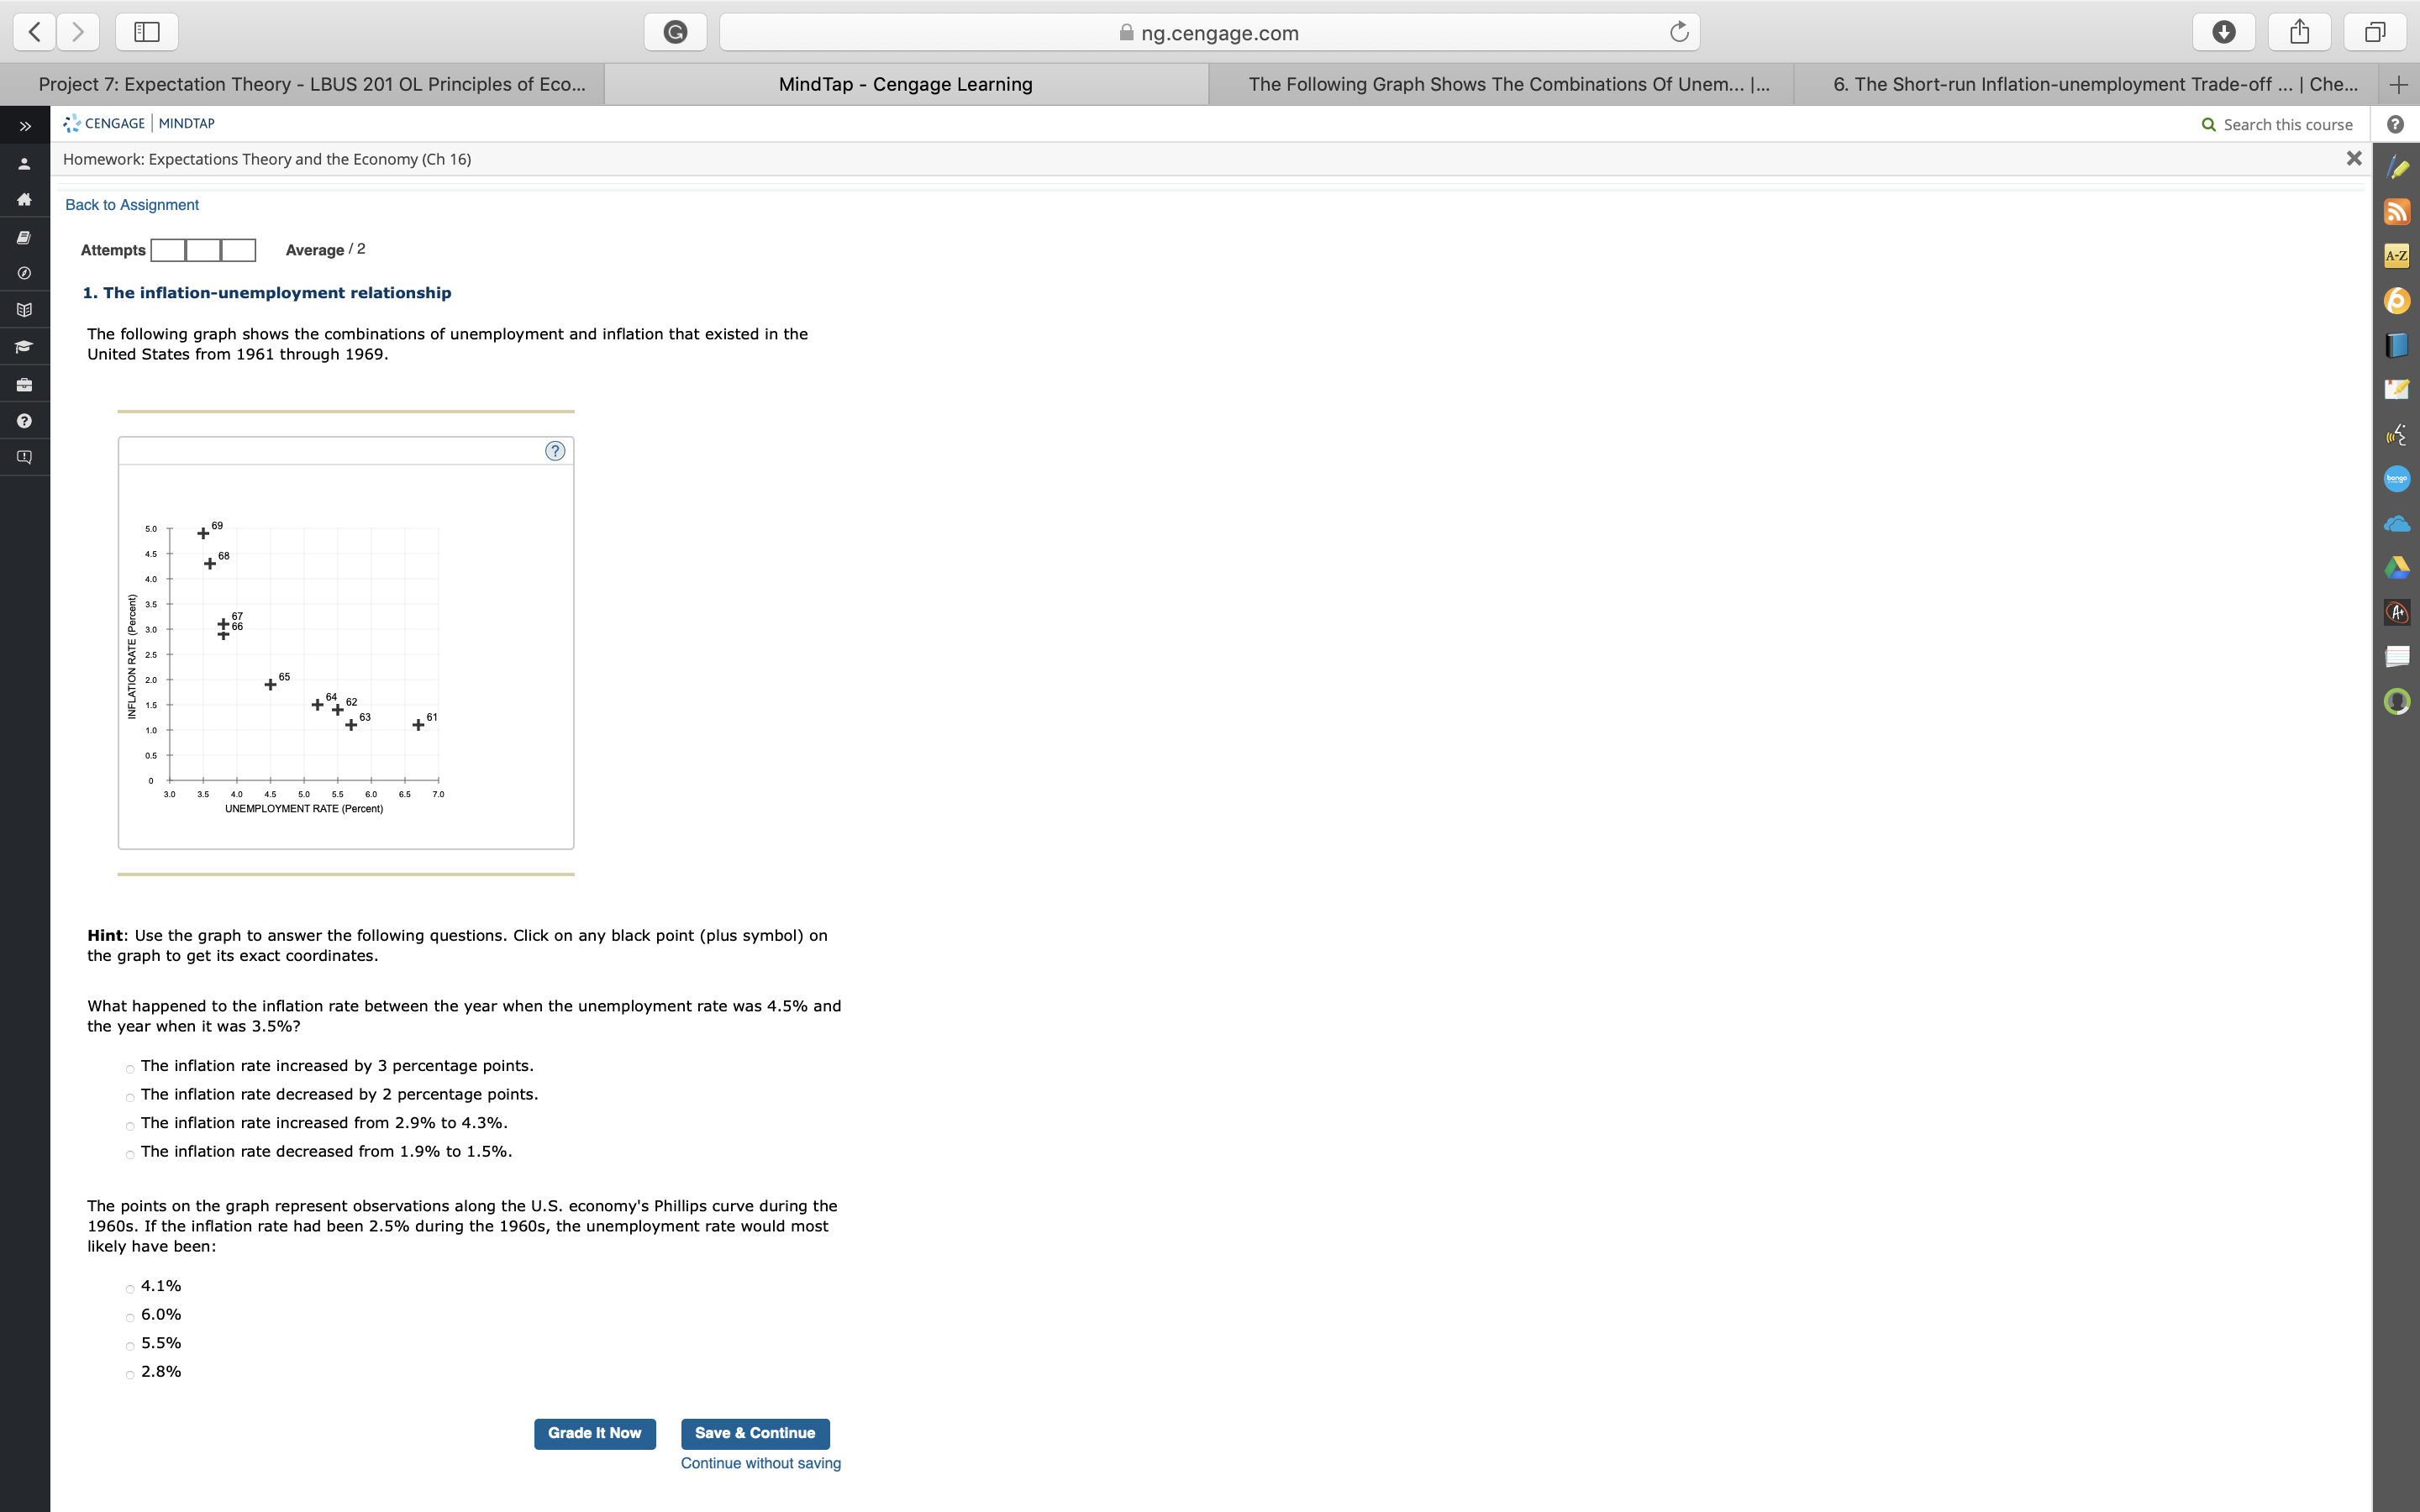
G ng.cengage.com C Project 7: Expectation Theory - LBUS 201 OL Principles of Eco... Mind Tap - Cengage Learning The Following Graph Shows The Combinations Of Unem... |... 6. The Short-run Inflation-unemployment Trade-off ... | Che... + CENGAGE | MINDTAP Q Search this course Homework: Expectations Theory and the Economy (Ch 16) X Back to Assignment Attempts Average / 2 A-Z O 1. The inflation-unemployment relationship The following graph shows the combinations of unemployment and inflation that existed in the United States from 1961 through 1969 ? 5.0 + 65 + 68 4.0 3.5 1 3.0 + 66 3 25 INFLATION RATE (Percent 8 20 65 1 04 163 + 61 0.5 3.5 UNEMPLOYMENT RATE (Percent) 6.5 Hint: Use the graph to answer the following questions. Click on any black point (plus symbol) on the graph to get its exact coordinates. What happened to the inflation rate between the year when the unemployment rate was 4.5% and the year when it was 3.5%? The inflation rate increased by 3 percentage points. The inflation rate decreased by 2 percentage points. The inflation rate increased from 2.9% to 4.3%. The inflation rate decreased from 1.9% to 1.5%. The points on the graph represent observations along the U.S. economy's Phillips curve during the 1960s. If the inflation rate had been 2.5% during the 1960s, the unemployment rate would most likely have been: 4.1% 6.0% 5.5% 2.8% Grade It Now Save & Continue Continue without saving
Step by Step Solution
There are 3 Steps involved in it

Get step-by-step solutions from verified subject matter experts