

Question: please help me with getting this info correct need a little extra help on this matter.Also the excel file that i must used is already
please help me with getting this info correct need a little extra help on this matter.Also the excel file that i must used is already uploaded and added as well not to use separate
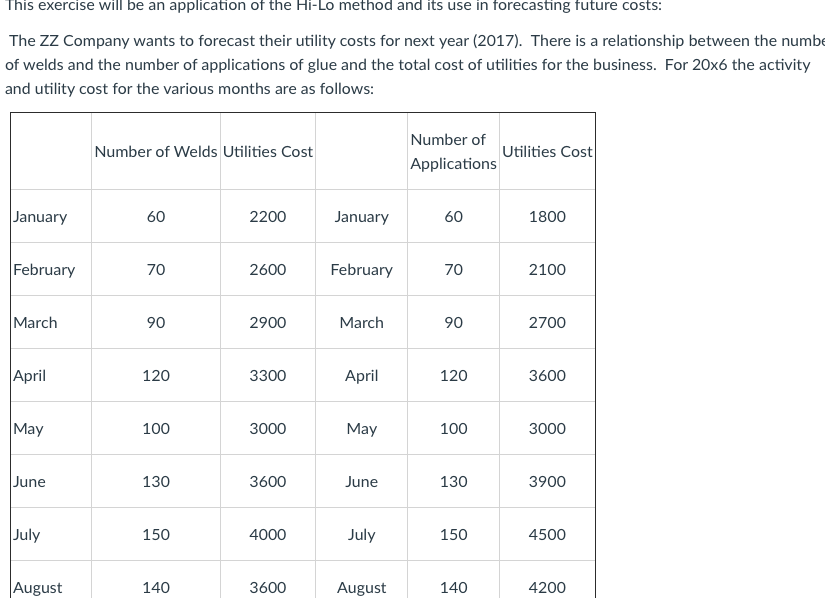
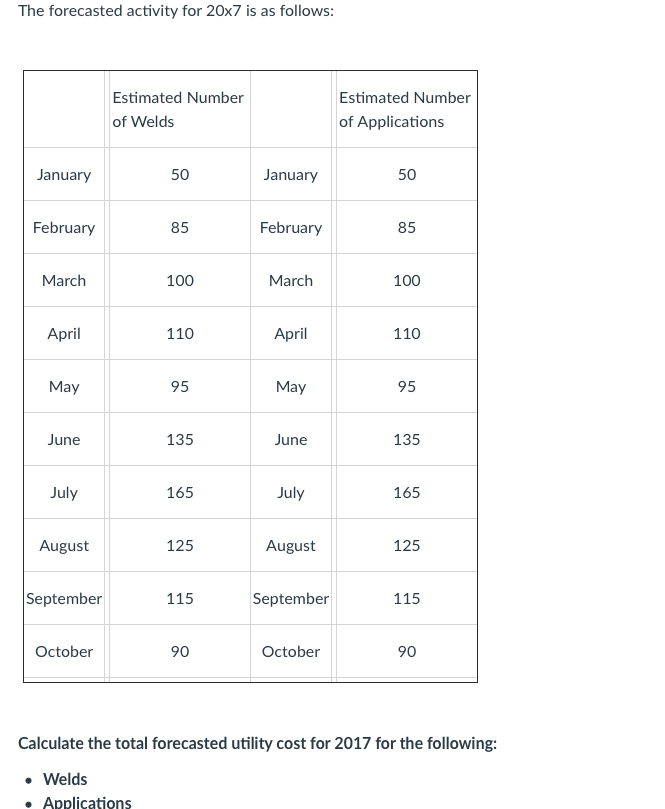

20X6 January February March April May June July August September October Mixed Number of Cost Welds Utilities Cost Check 60 $ 2,200.00 70 $ 2,600.00 90 $ 2,900.00 120 $ 3,300.00 100 $ 3,000.00 130 $ 3,600.00 150 $ 4,000.00 140 $ 3,600.00 110 $ 3,100.00 80 $ 2,500.00 January February March April May June July August September October Per Unit Variable Costs Total Fixed Costs Per Unit Variable Costs Total Fixed Costs Forecasted for 2017 January February March April May June July August September October Total Total Utility Cost Estimated Number of Projected Welds Utilities Cost 50 85 100 110 95 135 165 125 115 90 January February March April May June July August September October Total Number of Applications Mixed Cost Utilities Cost Check 60 $ 1,800.00 70 $ 2,100.00 90 $ 2,700.00 120 $ 3,600.00 100 $ 3,000.00 130 $ 3,900.00 150 $ 4,500.00 140 $ 4,200.00 110 $ 3,300.00 80 $ 2,400.00 ariable Costs Estimated Number of Applications 50 85 100 110 95 135 165 125 115 90 Projected Utilities Cost This exercise will be an application of the Hi-Lo method and its use in forecasting future costs: The 22 Company wants to forecast their utility costs for next year [20121. There is a relationship between the numb: of welds and the number of applications of glue and the total cost of utilities for the business. For 20:16 the activity and utility cost for the various months are as follows: Number of Welds Utilities Cost Number-of Utilities l[lost Applications January 60 2200 January 60 1300 February 70 2600 February 70 2100 March 90 2900 March 90 2?00 April 120 3300 April 120 3600 May 100 3000 May 100 3000 June 130 3600 June 130 3900 July 150 4000 July 150 4500 August 140 3600 August 140 4200 The forecasted activity for 20s? is as follows: Estimated Number Estimated Number of Welds of Applications 50 January 5U 35 February 35 March April May May June July July Augu st Augu st September September Detob er October Calculate the total forecasted utility cost for 201? for the following: o Welds 1 Applications
Step by Step Solution
There are 3 Steps involved in it

Get step-by-step solutions from verified subject matter experts