

Question: Please help me with my math homework Describe process: Probability of heads: 0.5 Summary Stats Number of tosses: 10 M | Mean = 0.473 Number
Please help me with my math homework
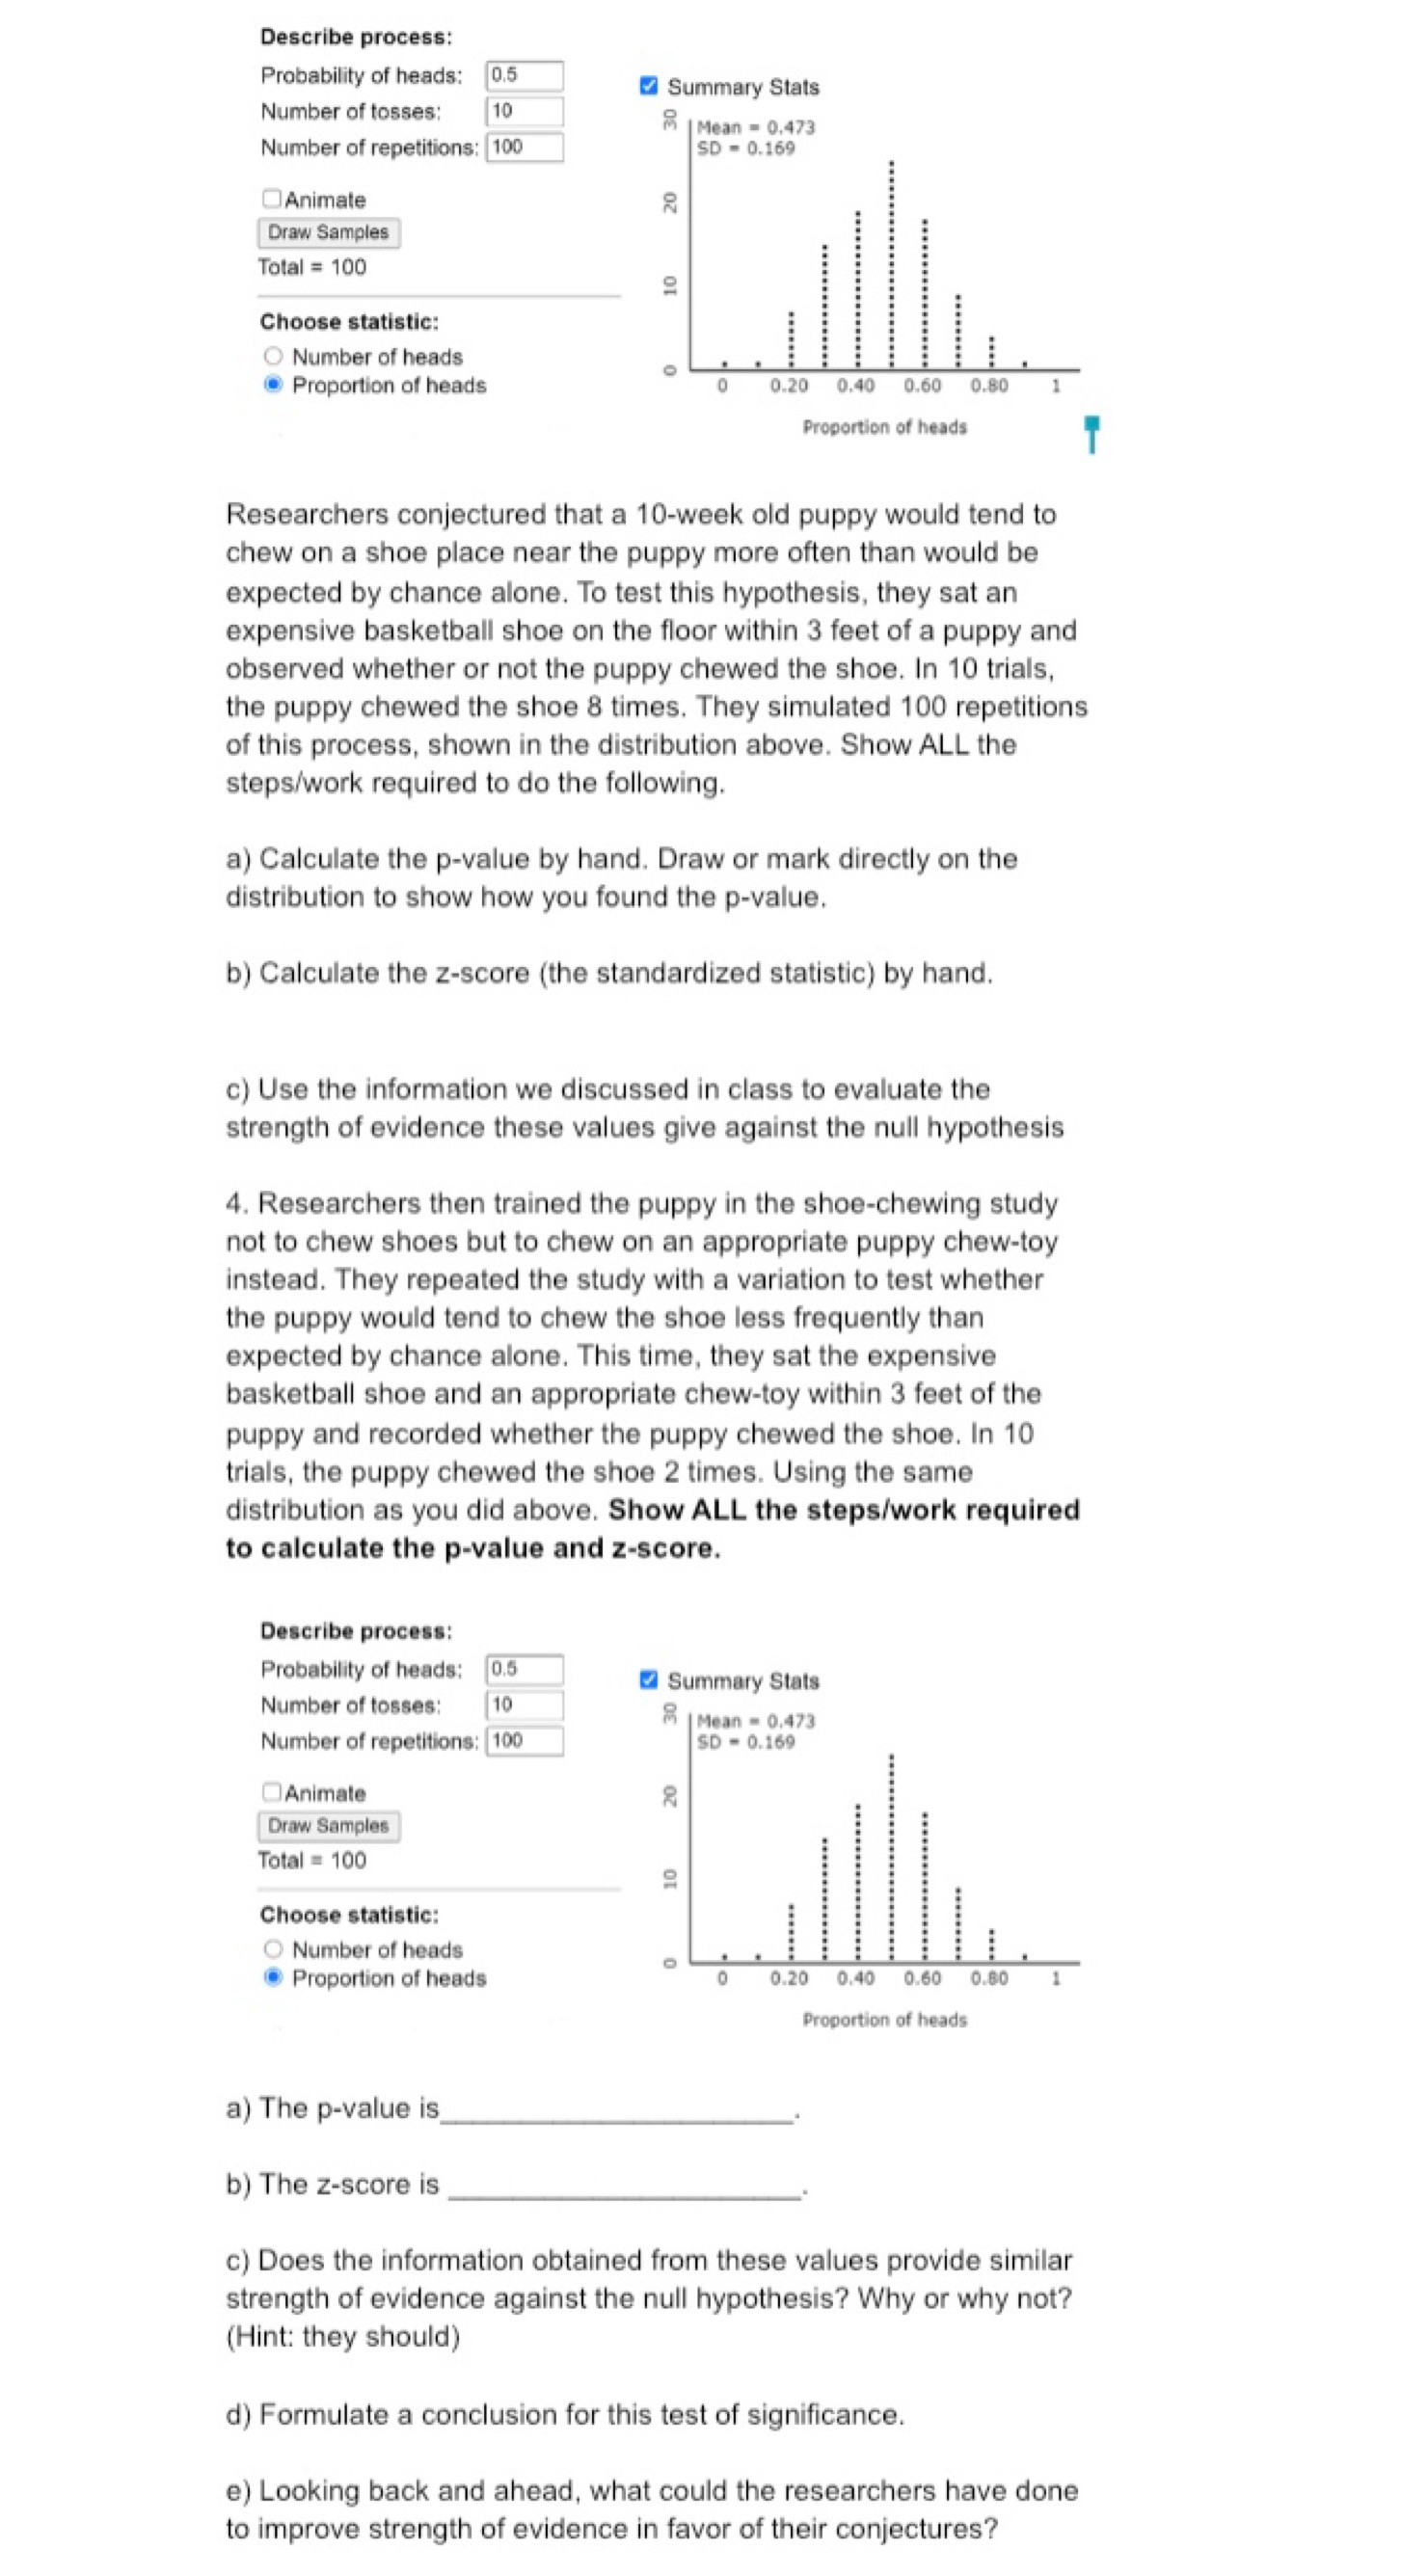
Describe process: Probability of heads: 0.5 Summary Stats Number of tosses: 10 M | Mean = 0.473 Number of repetitions: 100 SD - 0.169 OAnimate S Draw Samples Total = 100 2 Choose statistic: O Number of heads Proportion of heads 0.20 0.40 0.60 0.80 Proportion of heads Researchers conjectured that a 10-week old puppy would tend to chew on a shoe place near the puppy more often than would be expected by chance alone. To test this hypothesis, they sat an expensive basketball shoe on the floor within 3 feet of a puppy and observed whether or not the puppy chewed the shoe. In 10 trials, the puppy chewed the shoe 8 times. They simulated 100 repetitions of this process, shown in the distribution above. Show ALL the steps/work required to do the following. a) Calculate the p-value by hand. Draw or mark directly on the distribution to show how you found the p-value. b) Calculate the z-score (the standardized statistic) by hand. c) Use the information we discussed in class to evaluate the strength of evidence these values give against the null hypothesis 4. Researchers then trained the puppy in the shoe-chewing study not to chew shoes but to chew on an appropriate puppy chew-toy instead. They repeated the study with a variation to test whether the puppy would tend to chew the shoe less frequently than expected by chance alone. This time, they sat the expensive basketball shoe and an appropriate chew-toy within 3 feet of the puppy and recorded whether the puppy chewed the shoe. In 10 trials, the puppy chewed the shoe 2 times. Using the same distribution as you did above. Show ALL the steps/work required to calculate the p-value and z-score. Describe process: Probability of heads: 0.5 Number of tosses: 10 Summary Stats Number of repetitions: 100 | Mean = 0.473 SD - 0.169 OAnimate Draw Samples Total = 100 Choose statistic: O Number of heads Proportion of heads 0.20 0.40 0.60 0.80 Proportion of heads a) The p-value is b) The z-score is c) Does the information obtained from these values provide similar strength of evidence against the null hypothesis? Why or why not? (Hint: they should) d) Formulate a conclusion for this test of significance. e) Looking back and ahead, what could the researchers have done to improve strength of evidence in favor of their conjectures
Step by Step Solution
There are 3 Steps involved in it

Get step-by-step solutions from verified subject matter experts