

Question: please help me with part 2 a & b. i included my student data, histogram and descriptive stats PART 3 : Use the Sratistix 10
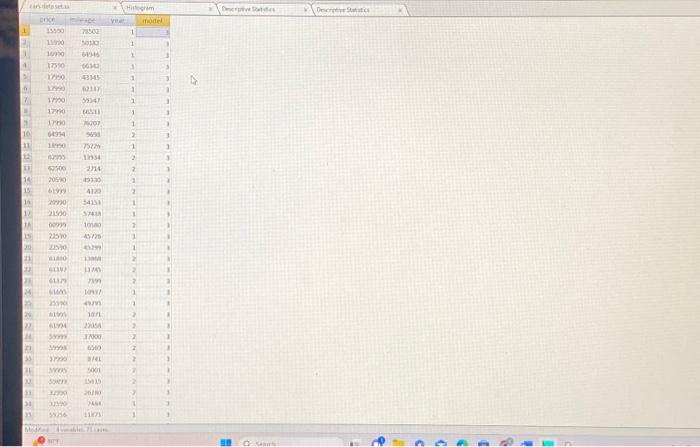
please help me with part 2 a & b. i included my student data, histogram and descriptive stats 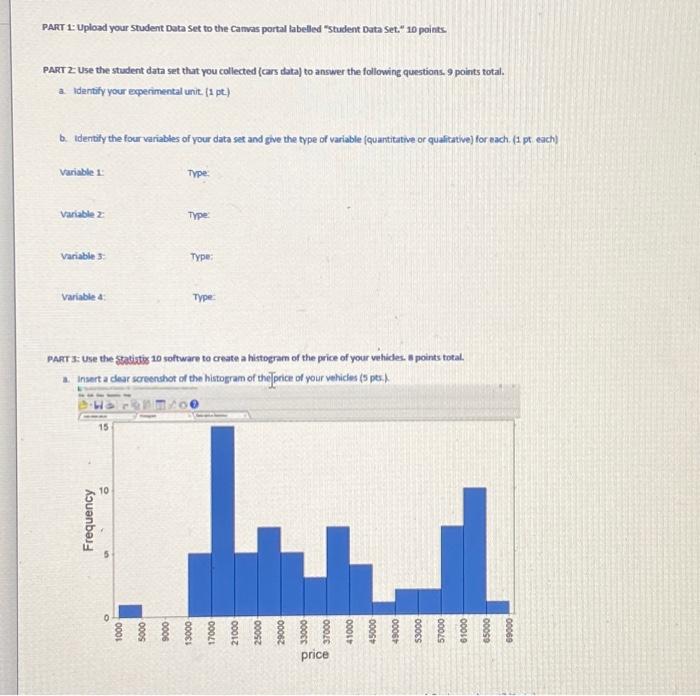
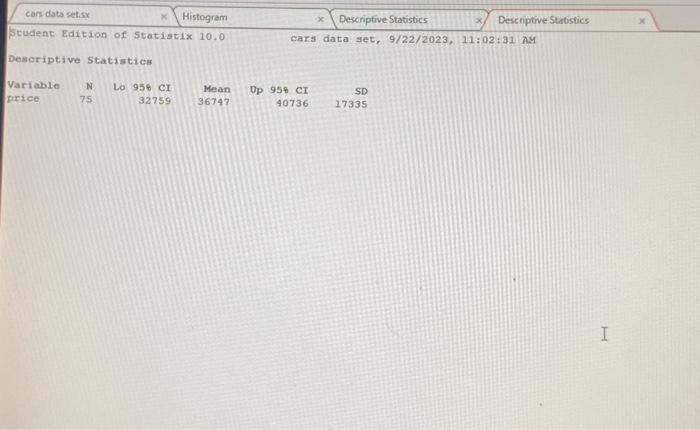
PART 3 : Use the Sratistix 10 software to create a histogram of the price of your vehicles. 8 points total. a. Insert a clear screendhot of the historram of thelprice of wour vehicles (5 pts) . Desoriptive Statistics \begin{tabular}{|l|r|r|r|r|r|r|r} Variable & N & Lo & 958CI & Mean & Op & 958CI & SD \\ price & 75 & & 32759 & 36747 & 40736 & 17335 \end{tabular}
Step by Step Solution
There are 3 Steps involved in it
1 Expert Approved Answer
Step: 1 Unlock

Question Has Been Solved by an Expert!
Get step-by-step solutions from verified subject matter experts
Step: 2 Unlock
Step: 3 Unlock