

Question: Please help me with part C, I have tried everything and its appears incorrect. 3. [0.6/1 Points] DETAILS PREVIOUS ANSWERS LCALCCON5 3.6.501.XP. MY NOTES ASK
Please help me with part C, I have tried everything and its appears incorrect.
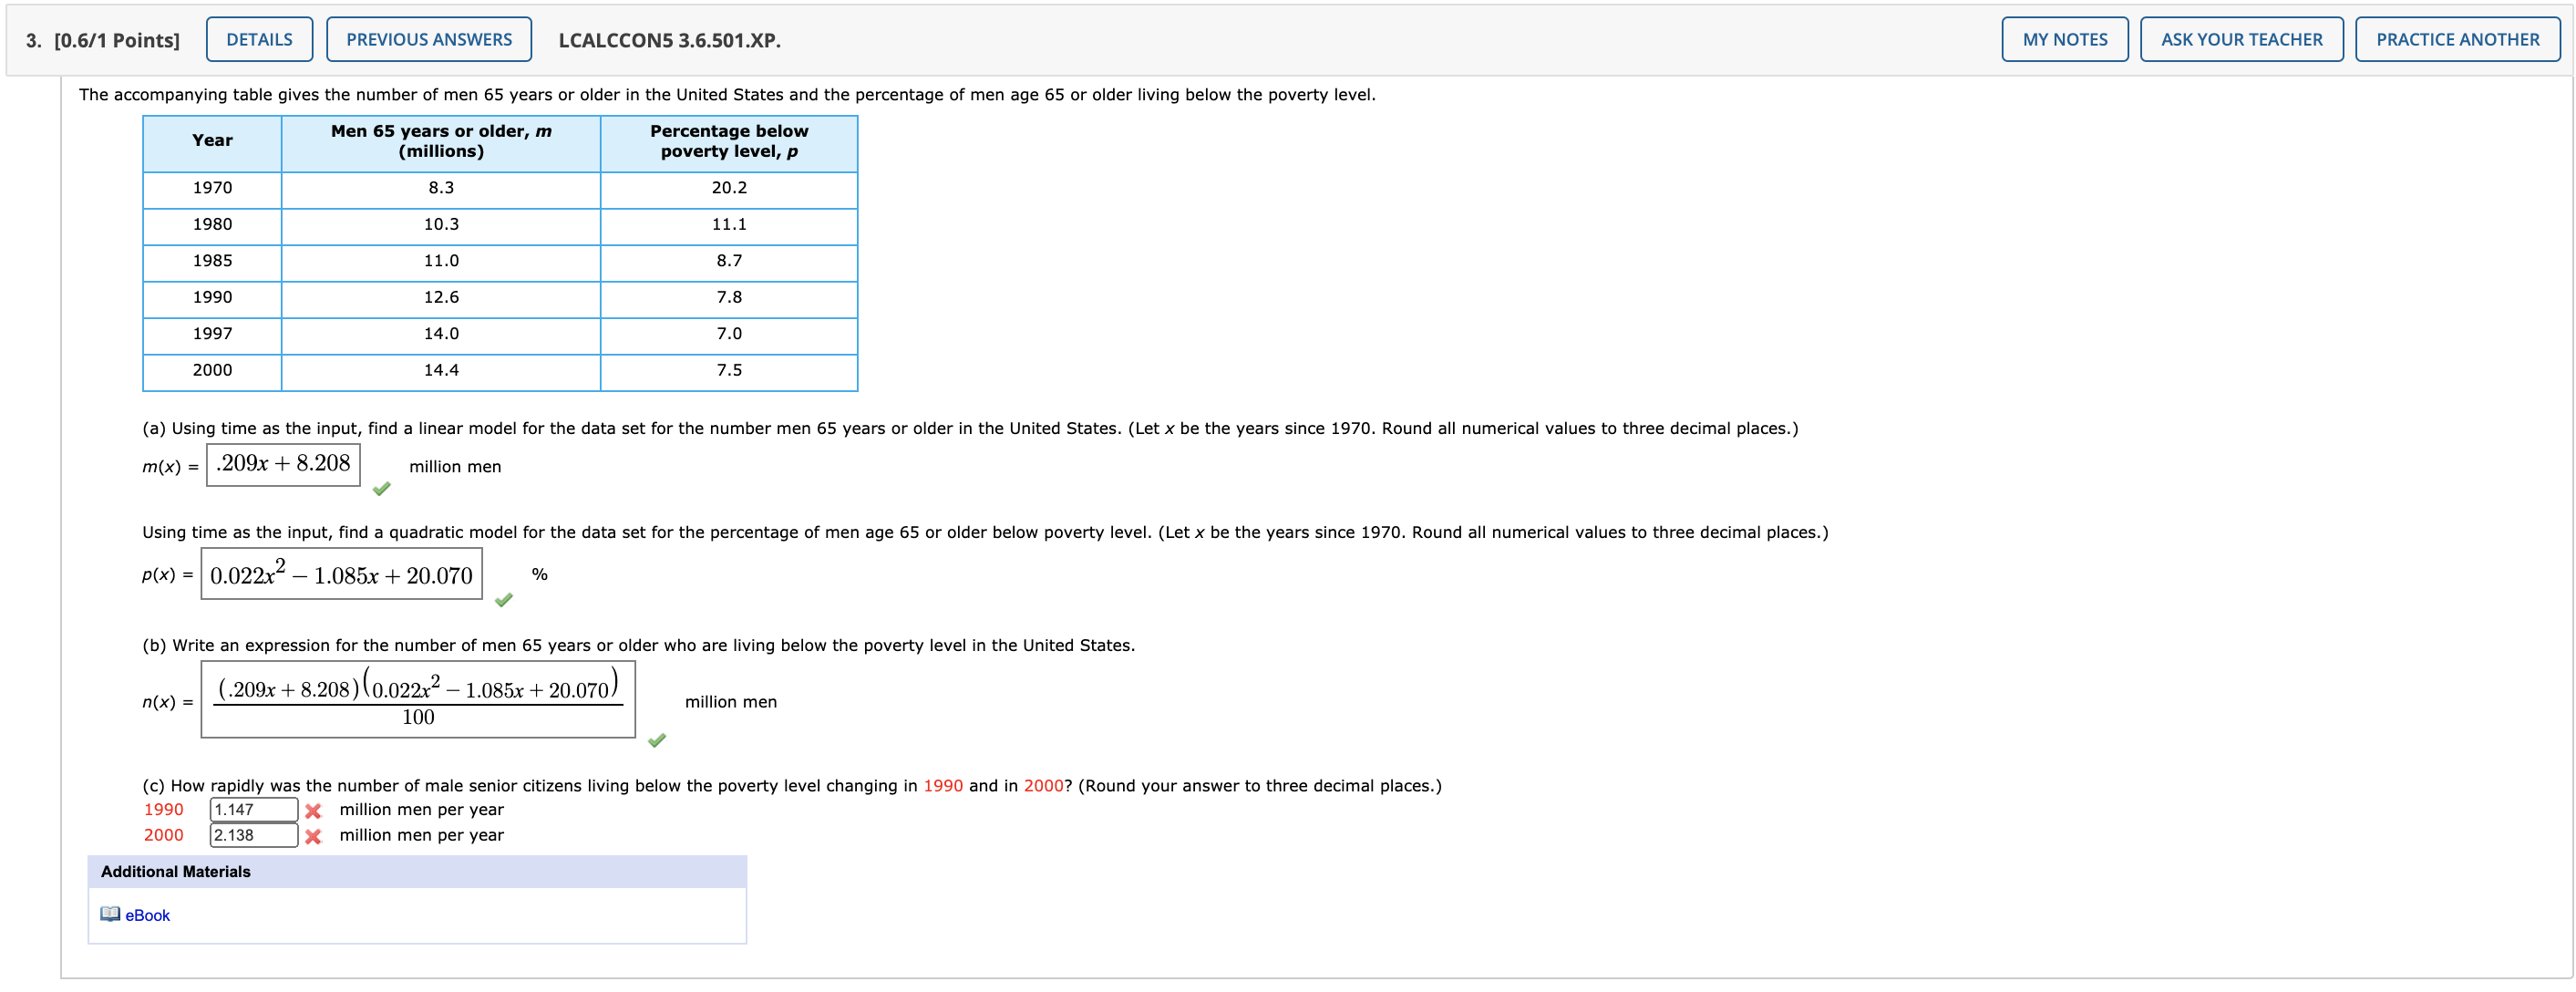
3. [0.6/1 Points] DETAILS PREVIOUS ANSWERS LCALCCON5 3.6.501.XP. MY NOTES ASK YOUR TEACHER PRACTICE ANOTHER The accompanying table gives the number of men 65 years or older in the United States and the percentage of men age 65 or older living below the poverty level. Year Men 65 years or older, m Percentage below (millions) poverty level, p 1970 8.3 20.2 1980 10.3 11.1 1985 11.0 8.7 1990 12.6 7.8 1997 14.0 7.0 2000 14.4 7.5 (a) Using time as the input, find a linear model for the data set for the number men 65 years or older in the United States. (Let x be the years since 1970. Round all numerical values to three decimal places.) m(x) = .209x + 8.208 million men Using time as the input, find a quadratic model for the data set for the percentage of men age 65 or older below poverty level. (Let x be the years since 1970. Round all numerical values to three decimal places.) p(x) = 0.022x - 1.085x + 20.070 (b) Write an expression for the number of men 65 years or older who are living below the poverty level in the United States. n ( x ) = (.209x + 8.208) (0.022x2 - 1.085x + 20.070) 100 million men c) How rapidly was the number of male senior citizens living below the poverty level changing in 1990 and in 2000? (Round your answer to three decimal places.) 1990 1.147 * million men per year 2000 2. 138 X million men per year Additional Materials eBook
Step by Step Solution
There are 3 Steps involved in it

Get step-by-step solutions from verified subject matter experts