

Question: Please help me with question #4 b, and question #6 b, please show the steps and details. 4. A statistician is following a group of
Please help me with question #4 b, and question #6 b, please show the steps and details.
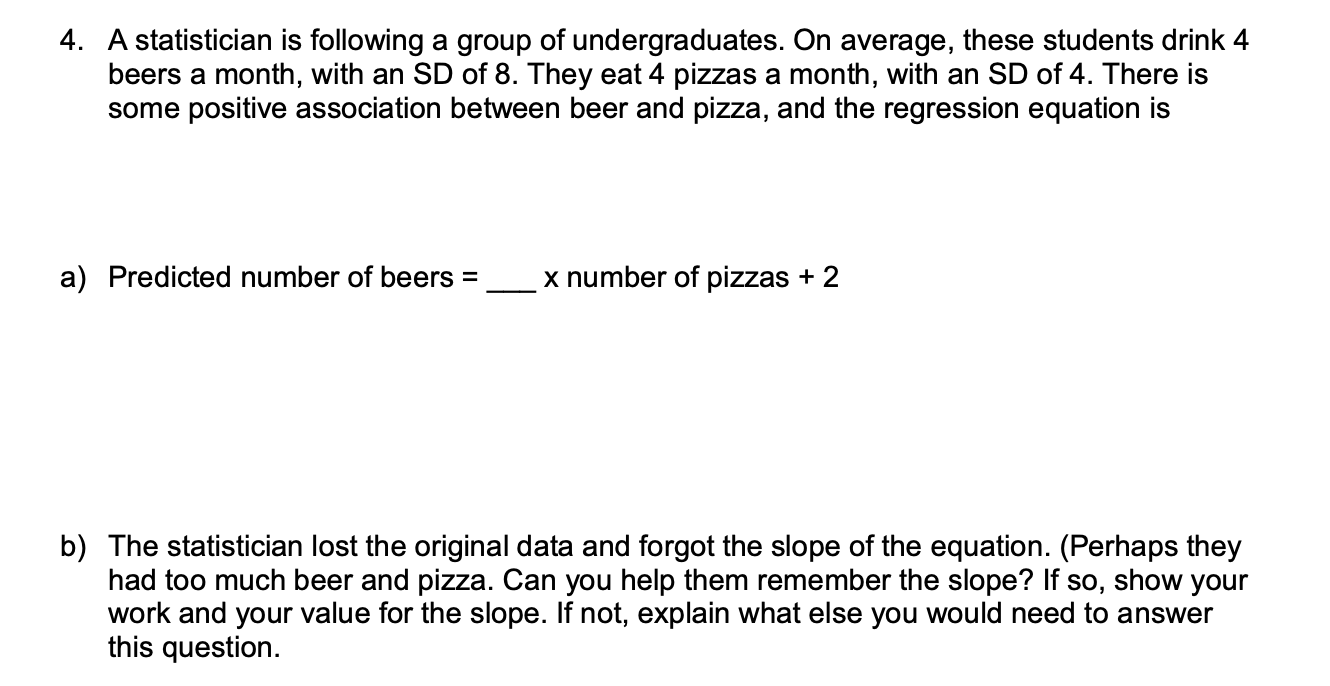
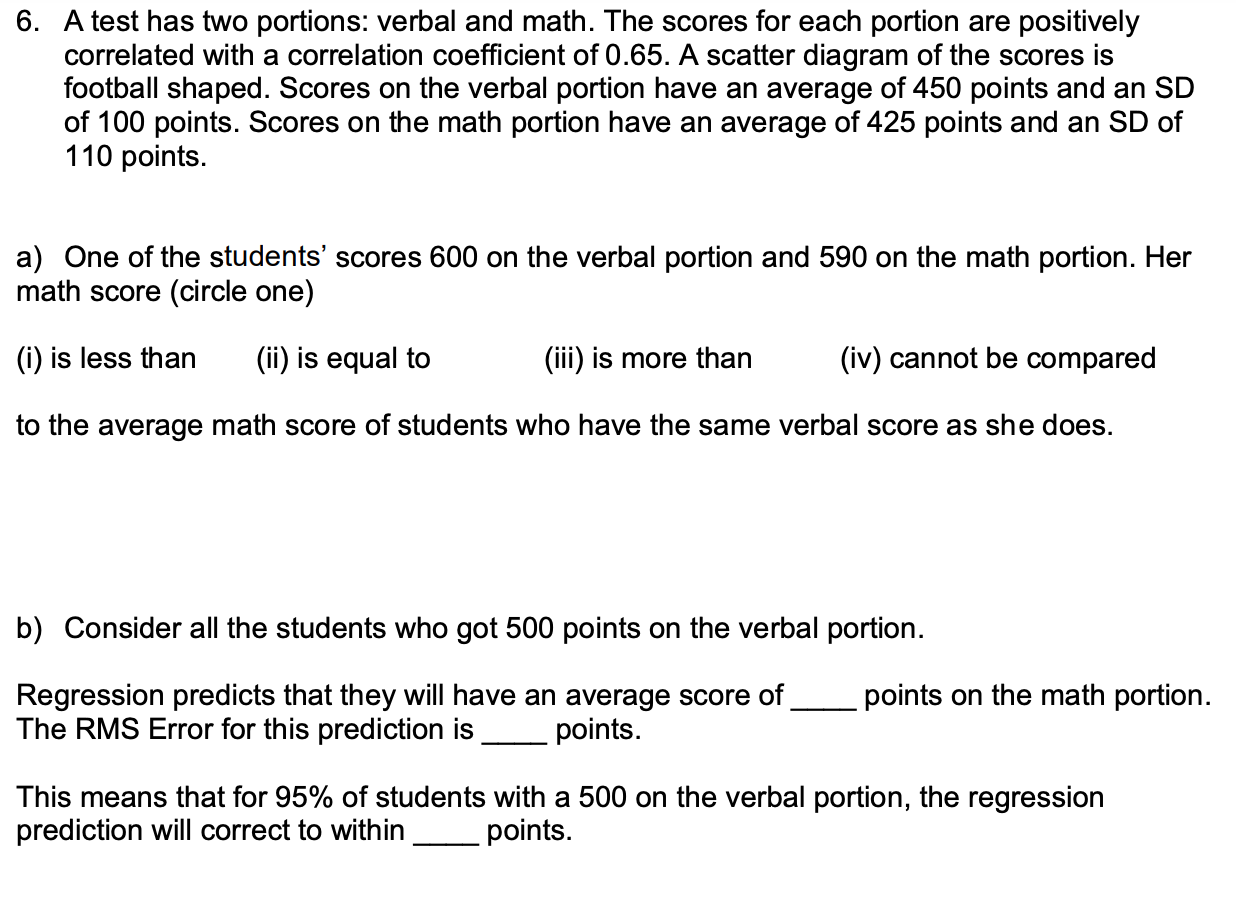
4. A statistician is following a group of undergraduates. On average, these students drink 4 beers a month, with an SD of 8. They eat4 pizzas a month, with an SD of 4. There is some positive association between beer and pizza, and the regression equation is a) Predicted number of beers = __ x number of pizzas + 2 b) The statistician lost the original data and forgot the slope of the equation. (Perhaps they had too much beer and pizza. Can you help them remember the slope? If so, show your work and your value for the slope. If not, explain what else you would need to answer this question. 6. A test has two portions: verbal and math. The scores for each portion are positively correlated with a correlation coefcient of 0.65. A scatter diagram of the scores is football shaped. Scores on the verbal portion have an average of 450 points and an SD of 100 points. Scores on the math portion have an average of 425 points and an SD of 110 points. a) One of the students\" scores 600 on the verbal portion and 590 on the math portion. Her math score (circle one) (i) is less than (ii) is equal to (iii) is more than (iv) cannot be compared to the average math score of students who have the same verbal score as she does. b) Consider all the students who got 500 points on the verbal portion. Regression predicts that they will have an average score of points on the math portion. The RMS Error for this prediction is points. This means that for 95% of students with a 500 on the verbal portion, the regression prediction will correct to within points
Step by Step Solution
There are 3 Steps involved in it

Get step-by-step solutions from verified subject matter experts