

Question: please help me with question 5 Round to Comparable 1 Ticker Comparable 2 Ticker Financial Facts Balance Sheet [Cash, Cash Equivalents And Short Term Investments]
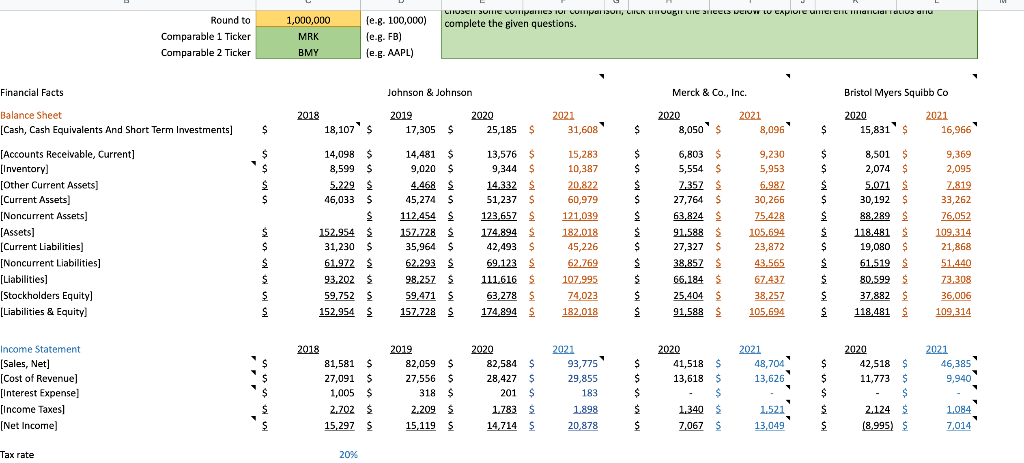
![Term Investments] [Accounts Receivable, Current] [Inventory] [Other Current Assets] [Current Assets] [Noncurrent](https://s3.amazonaws.com/si.experts.images/answers/2024/07/6697c541370d5_4646697c540ad18d.jpg)
![Assets] [Assets] [Current Liabilities] [Noncurrent Liabilities] [Liabilities] [Stockholders Equity] [Liabilities & Equity]](https://s3.amazonaws.com/si.experts.images/answers/2024/07/6697c541ec48e_4656697c5416f969.jpg)
![Income Statement [Sales, Net] [Cost of Revenue] [Interest Expense] [Income Taxes] [Net](https://s3.amazonaws.com/si.experts.images/answers/2024/07/6697c542bdbe5_4666697c542305e0.jpg)
![Income] Tax rate $ $ $ $ $ $ $ $ $](https://s3.amazonaws.com/si.experts.images/answers/2024/07/6697c5438b358_4676697c5430e4d4.jpg)
please help me with question 5
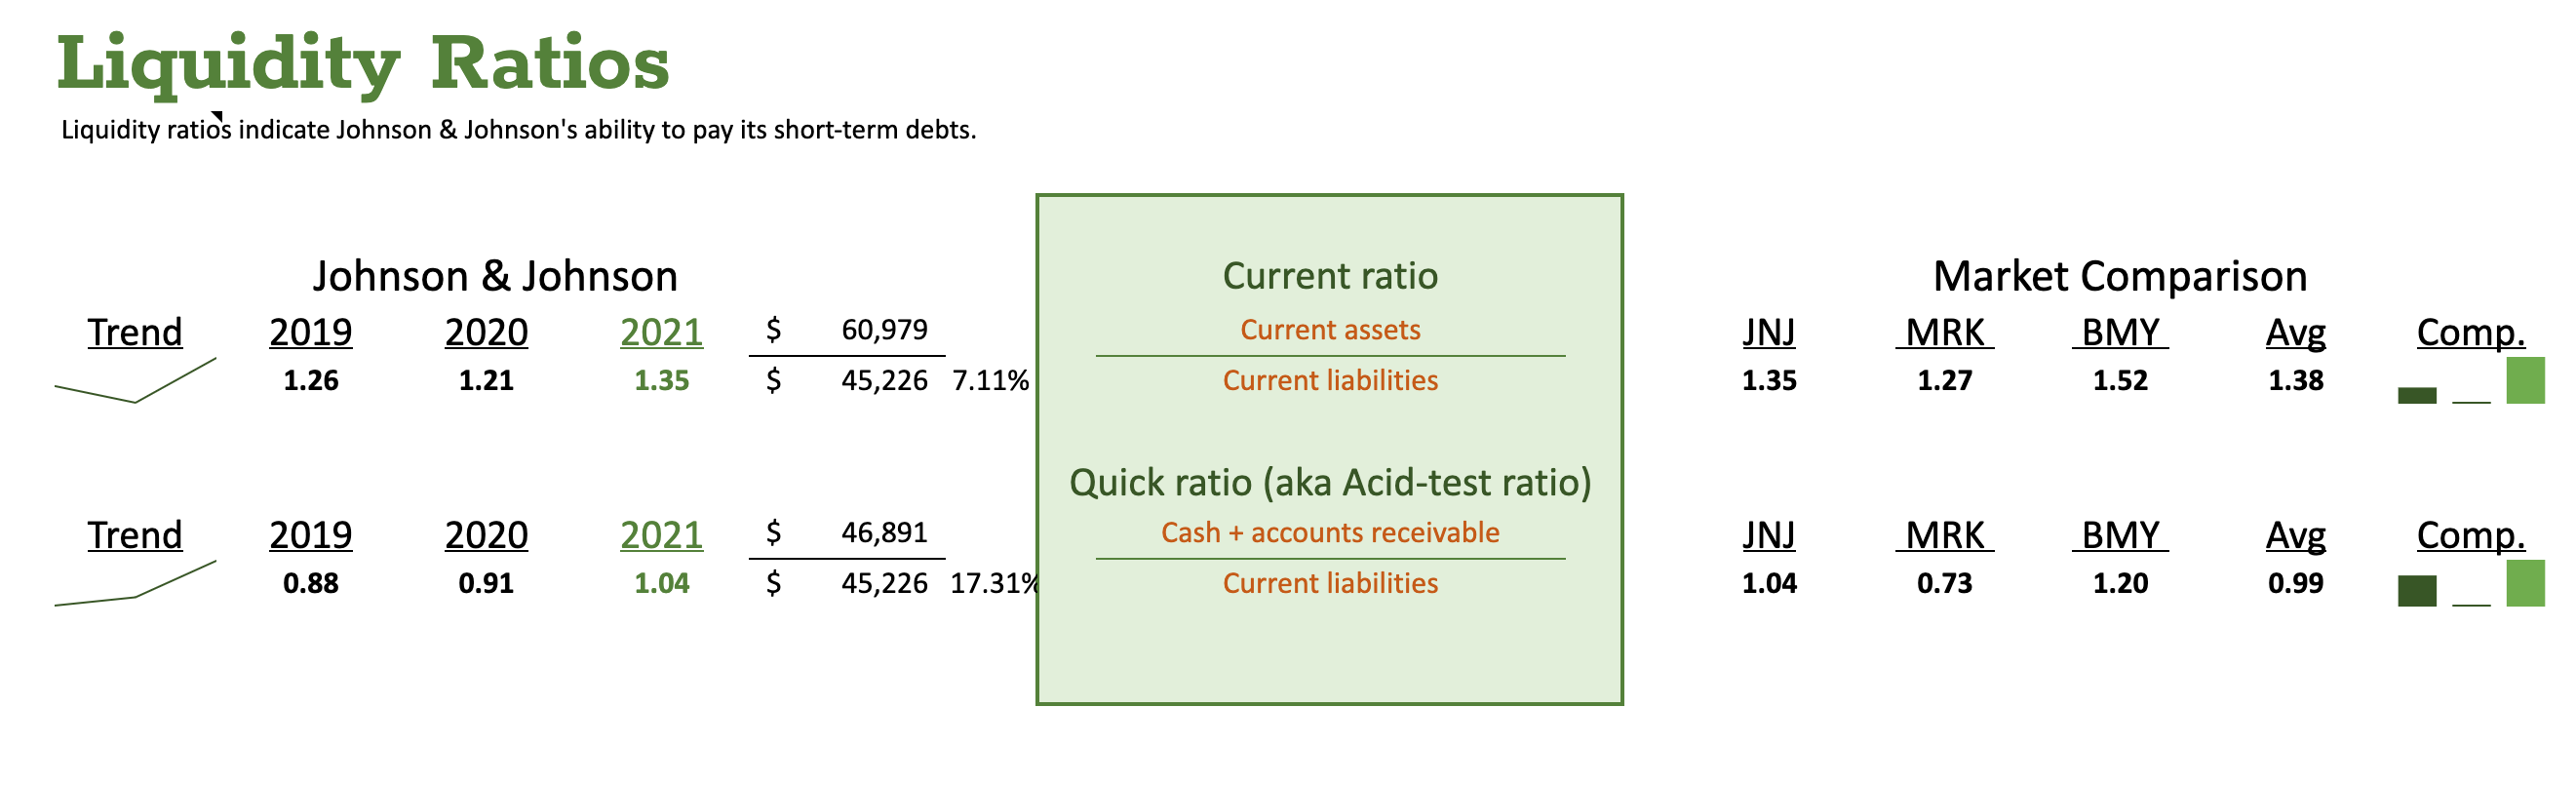
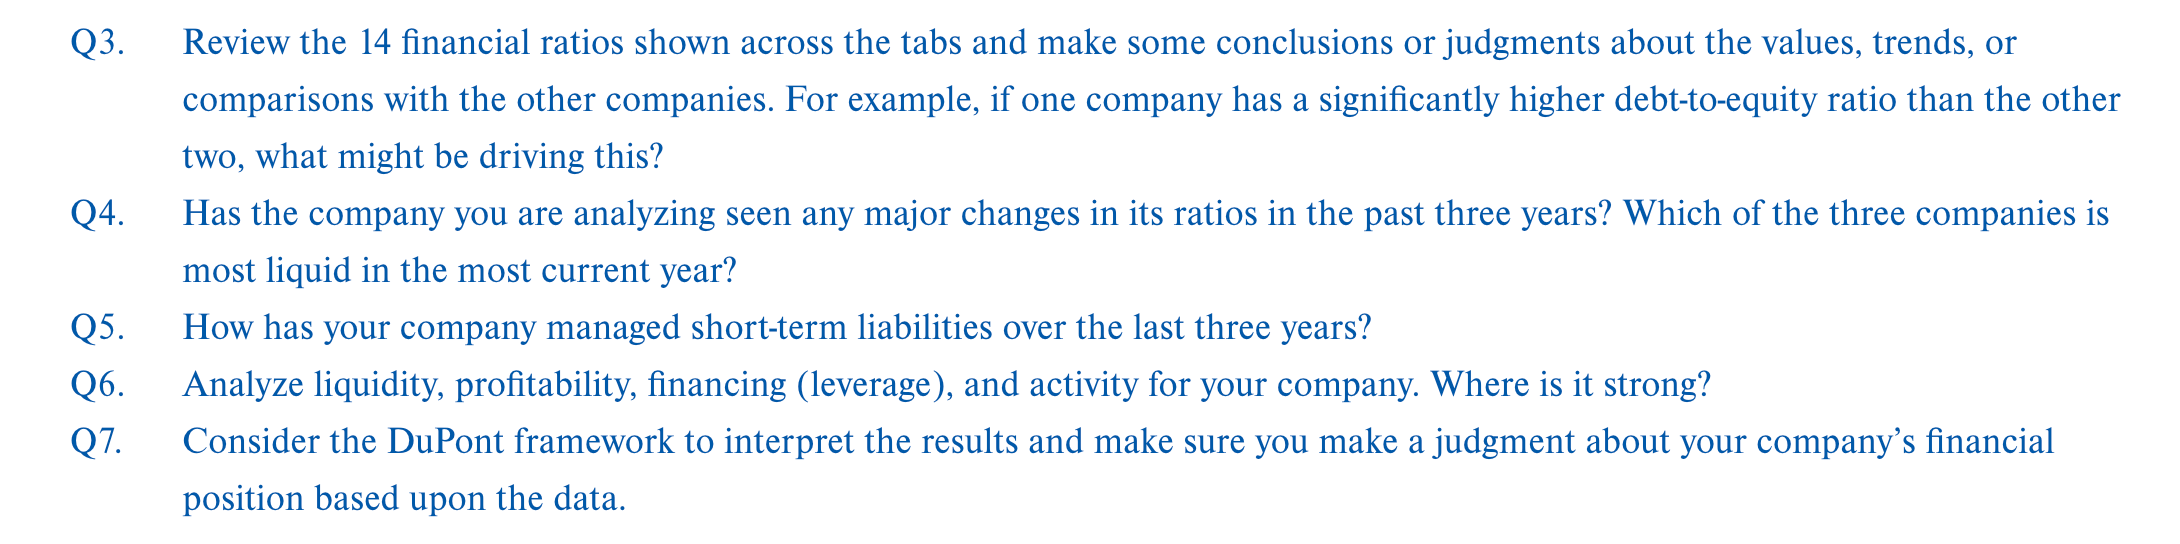
Round to Comparable 1 Ticker Comparable 2 Ticker Financial Facts Balance Sheet [Cash, Cash Equivalents And Short Term Investments] [Accounts Receivable, Current] [Inventory] [Other Current Assets] [Current Assets] [Noncurrent Assets] [Assets] [Current Liabilities] [Noncurrent Liabilities] [Liabilities] [Stockholders Equity] [Liabilities & Equity] Income Statement [Sales, Net] [Cost of Revenue] [Interest Expense] [Income Taxes] [Net Income] Tax rate $ $ $ $ $ $ $ $ $ $ $ 1,000,000 MRK BMY 2018 (e.g. 100,000) (e.g. FB) (e.g. AAPL) 18,107 $ 14,098 $ 8,599 $ 5,229 $ 46,033 $ $ 152,954 $ 31,230 $ 61,972 $ 93,202 $ 59,752 $ 152,954 $ 81,581 $ 27,091 $ 1,005 $ 2,702 $ 15,297 $ 20% 2018 chosen some companies for comparison, iek unrougir une aneet pelow to explore umferent maniciar ratios anu complete the given questions. Merck & Co., Inc. Bristol Myers Squibb Co 2020 15,831 $ 8,050 $ 8,501 $ 2,074 $ 5,071 $ 30,192 $ 6,803 $ 5,554 $ 7.357 $ 27,764 $ 63,824 $ 91.588 $ 27,327 $ 38,857 $ 66,184 $ 25,404 $ 91,588 $ 88,289 $ 118.481 $ 19,080 $ 61.519 $ 80,599 $ 37,882 $ 118,481 $ 2020 41,518 $ 13,618 $ $ 1,340 $ 7,067 $ 2020 42,518 $ 11,773 $ $ 2.124 $ (8,995) $ Johnson & Johnson 2019 17,305 $ 14,481 $ 9,020 $ 4.468 $ 45,274 $ 112,454 $ 157.728 S 35,964 $ S 62.293 S 98,257 $ 59,471 $ 157,728 $ 82,059 $ 27,556 $ 318 $ 2,209 $ 15,119 $ 2019 2020 25,185 $ 13,576 $ 9,344 $ 14.332 $ 51,237 $ 31,257 123,657 $ 174,894 $ 42.493 S 69,123 S 111.616 $ 63,278 S 174,894 $ 82,584 $ 28,427 $ 201 $ 1,783 S 14,714 $ 2020 2021 31,608 15,283 10,387 20.822 60,979 oupara 121,039 182.018 45,226 62.769 107,995 74,023 182,018 2021 93,775 29,855 183 1.898 20,878 $ $ $ $ $ $ $ $ $ $ $ $ $ $ $ $ $ 2020 2021 8,096 9,230 5,953 6.987 30,266 30,200 15,420 105,694 23,872 43.565 67,437 38,257 105,694 48,704 13,626 1.521 13,049 2021 $ $ $ $ $ S 2 $ $ $ $ $ $ $ $ S $ 2021 16,966 9,369 2,095 7,819 33,262 33,402 76,092 76,052 109,314 21,868 51,440 73,308 36,006 109,314 2021 46,385 9,940 1,084 7,014 Liquidity Ratios Liquidity ratios indicate Johnson & Johnson's ability to pay its short-term debts. Johnson & Johnson Trend 2020 2021 $ 60,979 1.21 1.35 $ Trend 2020 2021 $ 0.91 1.04 $ 2019 1.26 2019 0.88 45,226 7.11% 46,891 45,226 17.31% Current ratio Current assets Current liabilities Quick ratio (aka Acid-test ratio) Cash + accounts receivable Current liabilities JNJ 1.35 JNJ 1.04 Market Comparison MRK BMY Avg 1.27 1.52 1.38 MRK BMY Avg 0.73 1.20 0.99 Comp. Comp. Financing Ratios Financing ratios indicate Johnson & Johnson's ability to pay its long-term debts and shows financial leverage. Johnson & Johnson Trend 2020 $ 107,995 1.76 74,023 -11.70% Trend 2020 83.07 183 126.09% 2019 1.65 2019 55.49 2021 1.46 $ 2021 125.46 $ $ 22,959 Debt to equity Total liabilities Shareholders' equity Times interest earned NI + Interest expense + Income taxes Interest expense JNJ 1.46 JNJ 125.46 Market Comparison MRK 1.76 MRK BMY Comp. 2.04 BMY Comp. Johnson & Johnson 2020 0.50 2020 5.89 2020 62 2020 3.10 2020 118 Trend 2019 0.53 Trend 2019 5.74 Trend 2019 64 Trend 2019 3.13 Trend 2019 117 2021 $ 93,775 0.53 $ 178,456 -0.52% 2021 $ 93,775 6.50 $ 14,430 13.17% 365 2021 56 6.50 -11.64% 2021 $ 29,855 3.03 $ 9,866 -3.25% 2021 121 365 3.03 Asset turnover Net sales Average total assets Receivable turnover Net sales Average accounts receivable (net) Average collection period 365 Receivables turnover Inventory turnover Cost of goods sold Average inventory Average days in inventory 365 Inventory turnover JNJ 0.53 JNJ 6.50 JNJ 56 JNJ 3.03 JNJ 120.61 Market Comparison MRK BMY Comp. 0.49 0.41 MRK BMY Comp. 6.08 5.19 Comp. MRK 60 BMY 70 MRK BMY Comp. 2.37 4.77 MRK BMY Comp. 154.12 76.54 Johnson & Johnson 2020 2021 $ 20,878 0.18 0.22 $ 93.775 20.84% 2020 2021 $ 20,878 2.21% 2.92% $ 178,456 20.20% 2020 2021 $ 21,024 8.97% 11.78% $ 178,456 18.55% 2020 2021 $ 20,878 5.99% 7.60% 68.651 19.91% 2021 $ 178,456 2.60 $ 68,651 -0.25% Trend 2019 0.18 Trend 2019 2.43% Trend 2019 9.94% Trend 2019 6.34% Trend 2019 2.61 2020 2.71 Profit margin on sales Net income Net sales Return on assets (ROA) Net income Average total assets Return on assets (+interest) NI + Interest expense x (1 - tax rate) Average total assets Return on equity (ROE) Net income Average shareholders' equity Equity multiplier Average total assets Average total equity JNJ 0.22 JNJ 2.92% JNJ 11.78% JNJ 7.60% JNJ 2.60 Market Comparison MRK BMY Comp. 0.27 0.15 MRK BMY Comp. 1.54% 3.31% MRK BMY Comp. 13.23% 6.16% MRK BMY Comp. 10.25% 4.75% MRK BMY Comp. 3.10 3.08 Johnson & Johnson 2020 2021 $ 20,878 0.24 0.30 $ 68,651 2020 2021 $ 20,878 0.18 0.22 $ 93,775 2020 2021 $ 93,775 0.50 0.53 $ 178,456 2021 $ 178,456 2020 2.71 2.60 $ 68,651 Trend 2019 0.25 Trend 2019 0.18 Trend 2019 0.53 Trend 2019 2.61 Return on equity (ROE) Net income Average shareholders' equity Profit margin (PM) Net income Net sales Asset turnover (AT) Net sales Average total assets Equity multiplier (EM) Average total assets Average total equity DuPont Framework ROE = PM x ATX EM Market Comparison 2020 JNJ MRK 0.30 0.41 BMY Comp. 0.19 BMY Comp. JNJ MRK 0.22 0.27 0.15 MRK BMY Comp. JNJ 0.53 0.49 0.41 JNJ MRK BMY Comp. 2.60 3.10 3.08 JNJ MRK BMY Comp. 0.30 0.41 0.19 Q3. Review the 14 financial ratios shown across the tabs and make some conclusions or judgments about the values, trends, or comparisons with the other companies. For example, if one company has a significantly higher debt-to-equity ratio than the other two, what might be driving this? Q4. Has the company you are analyzing seen any major changes in its ratios in the past three years? Which of the three companies is most liquid in the most current year? Q5. How has your company managed short-term liabilities over the last three years? Q6. Analyze liquidity, profitability, financing (leverage), and activity for your company. Where is it strong? Q7. Consider the DuPont framework to interpret the results and make sure you make a judgment about your company's financial position based upon the data
Step by Step Solution
There are 3 Steps involved in it

Get step-by-step solutions from verified subject matter experts