

Question: Please help me with question 5 to plot on Excel. Thank you on your results. 5. Consider an annual coupon bond with face value $100
Please help me with question 5 to plot on Excel. Thank you
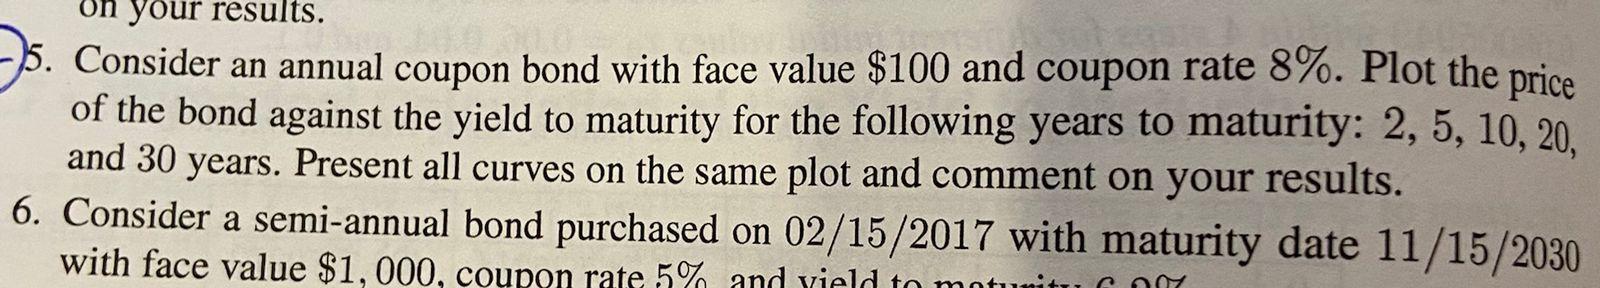
on your results. 5. Consider an annual coupon bond with face value $100 and coupon rate 8%. Plot the price of the bond against the yield to maturity for the following years to maturity: 2, 5, 10, 20, and 30 years. Present all curves on the same plot and comment on your results. 6. Consider a semi-annual bond purchased on 02/15/2017 with maturity date 11/15/2030 with face value $1,000, coupon rate 5% and yield to motur a 4
Step by Step Solution
There are 3 Steps involved in it
1 Expert Approved Answer
Step: 1 Unlock

Question Has Been Solved by an Expert!
Get step-by-step solutions from verified subject matter experts
Step: 2 Unlock
Step: 3 Unlock