

Question: Please help me with steps. b) Discuss in context Trend, Strength and Shape c) What is the correlation coefficient and regression equation? d) Discuss in
Please help me with steps.
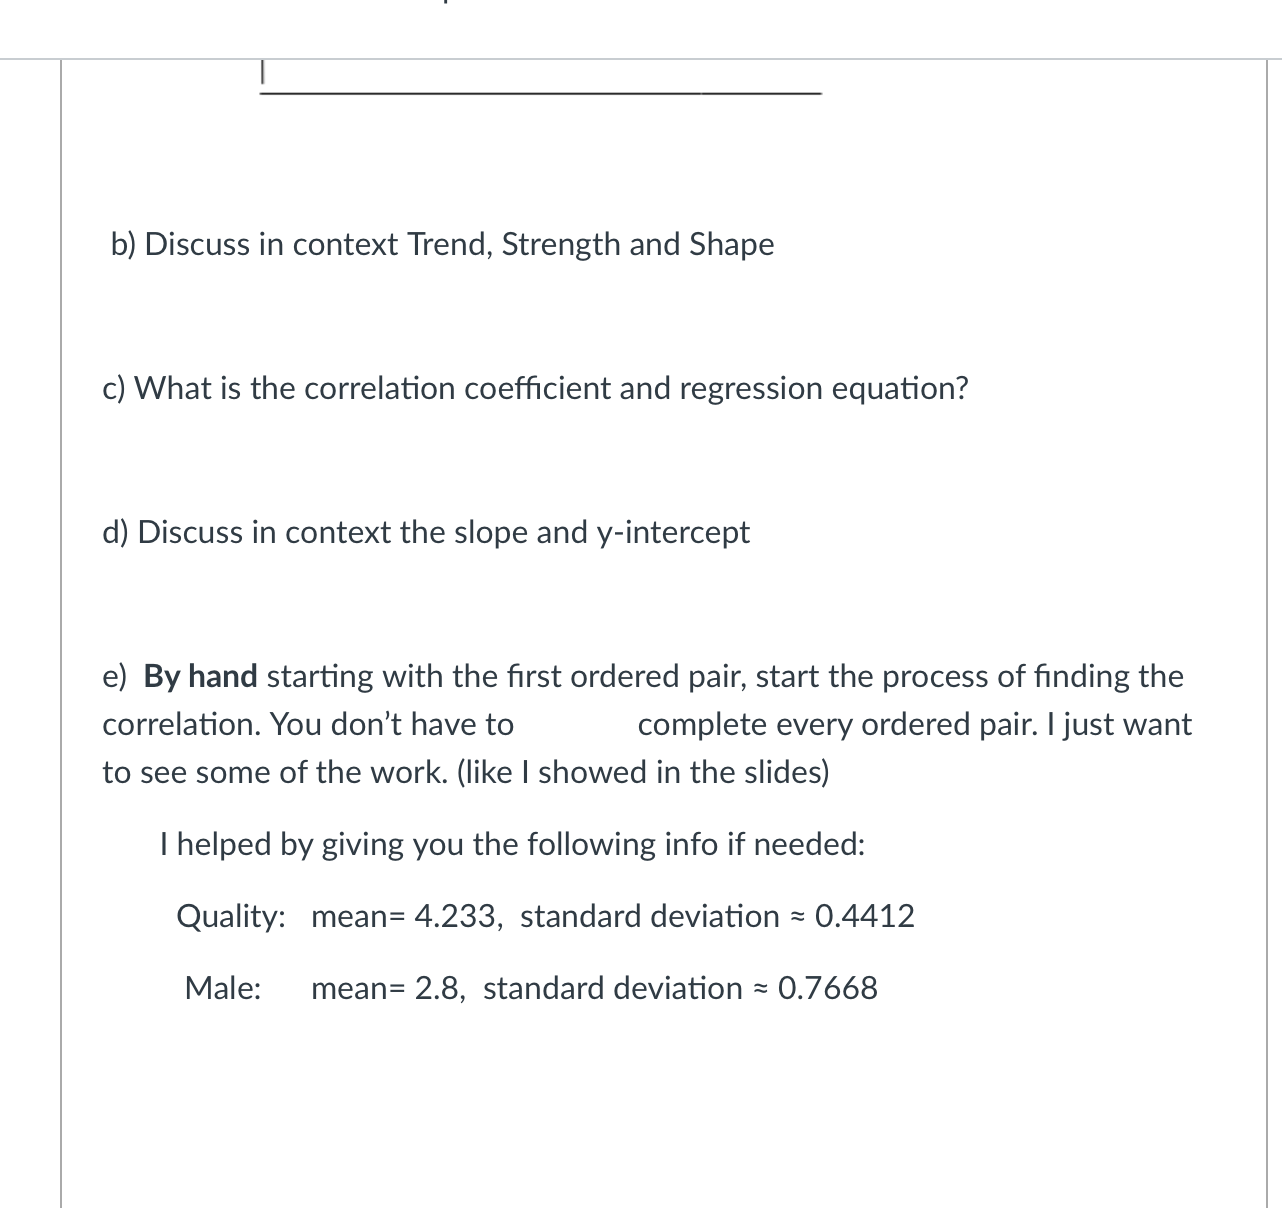
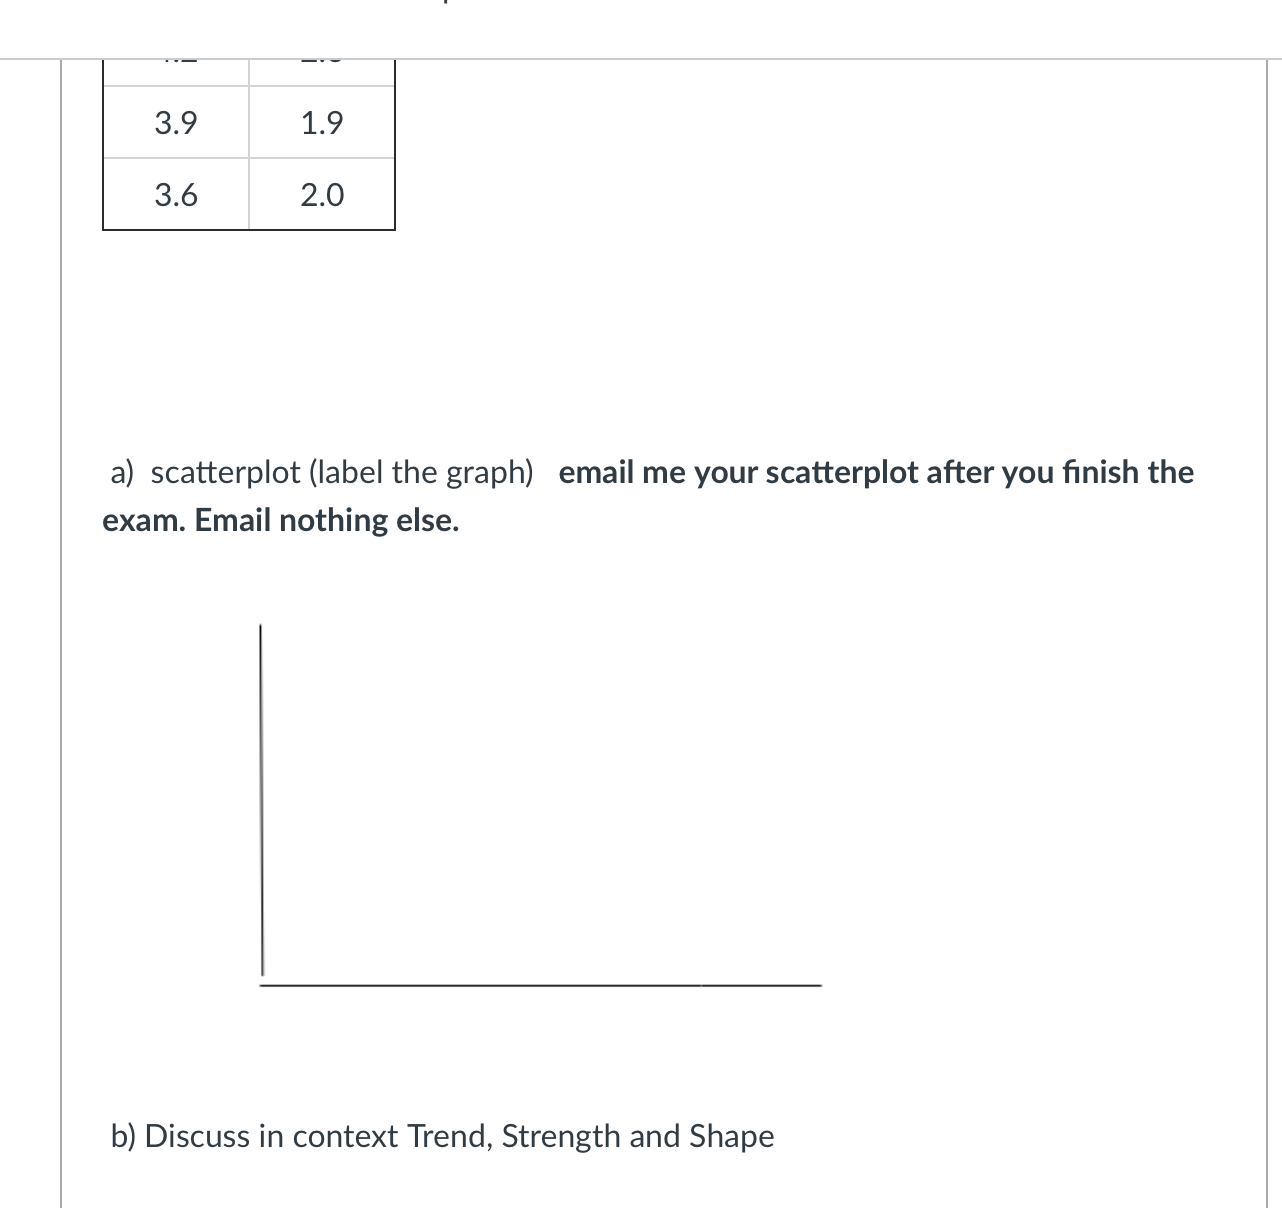
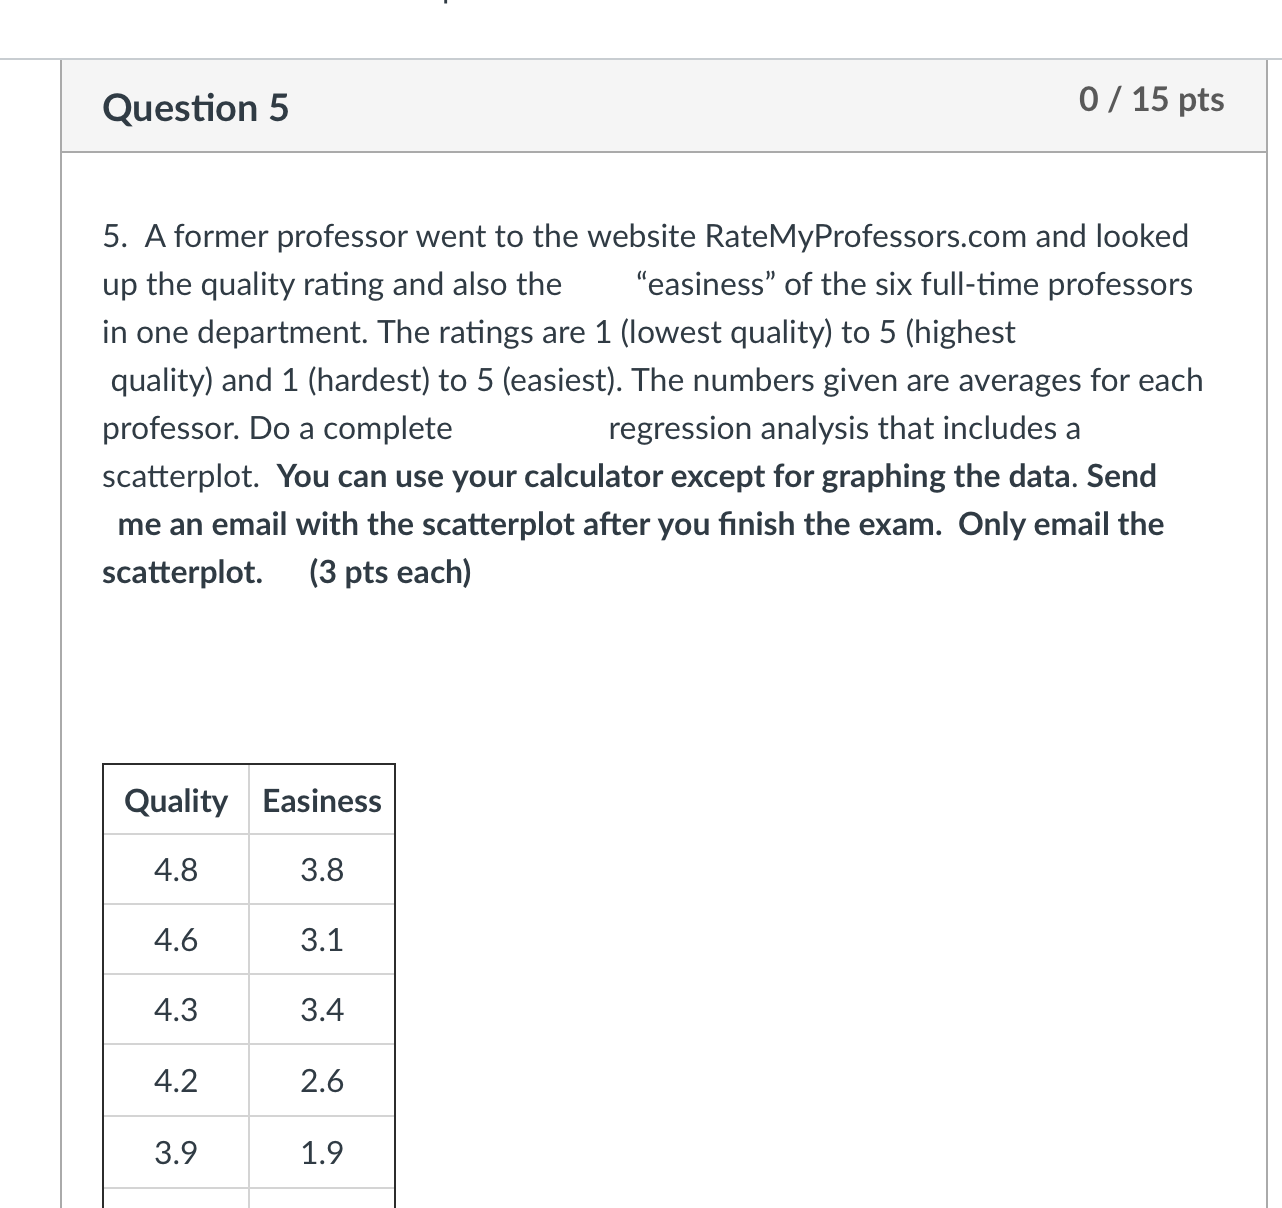
b) Discuss in context Trend, Strength and Shape c) What is the correlation coefficient and regression equation? d) Discuss in context the slope and y-intercept e) By hand starting with the first ordered pair, start the process of finding the correlation. You don't have to complete every ordered pair. I just want to see some of the work. (like I showed in the slides) I helped by giving you the following info if needed: Quality: mean= 4.233, standard deviation = 0.4412 Male: mean= 2.8, standard deviation = 0.76683.9 1.9 3.6 2.0 a) scatterplot (label the graph) email me your scatterplot after you finish the exam. Email nothing else. b) Discuss in context Trend, Strength and ShapeQuestion 5 0 / 15 pts 5. A former professor went to the website RateMyProfessors.com and looked up the quality rating and also the "easiness" of the six full-time professors in one department. The ratings are 1 (lowest quality) to 5 (highest quality) and 1 (hardest) to 5 (easiest). The numbers given are averages for each professor. Do a complete regression analysis that includes a scatterplot. You can use your calculator except for graphing the data. Send me an email with the scatterplot after you nish the exam. Only email the scatterplot. (3 pts each) Quality Easiness 4.8 3.8 4.6 3.1 4.3 3.4 4.2 2.6 3.9 1.9
Step by Step Solution
There are 3 Steps involved in it

Get step-by-step solutions from verified subject matter experts