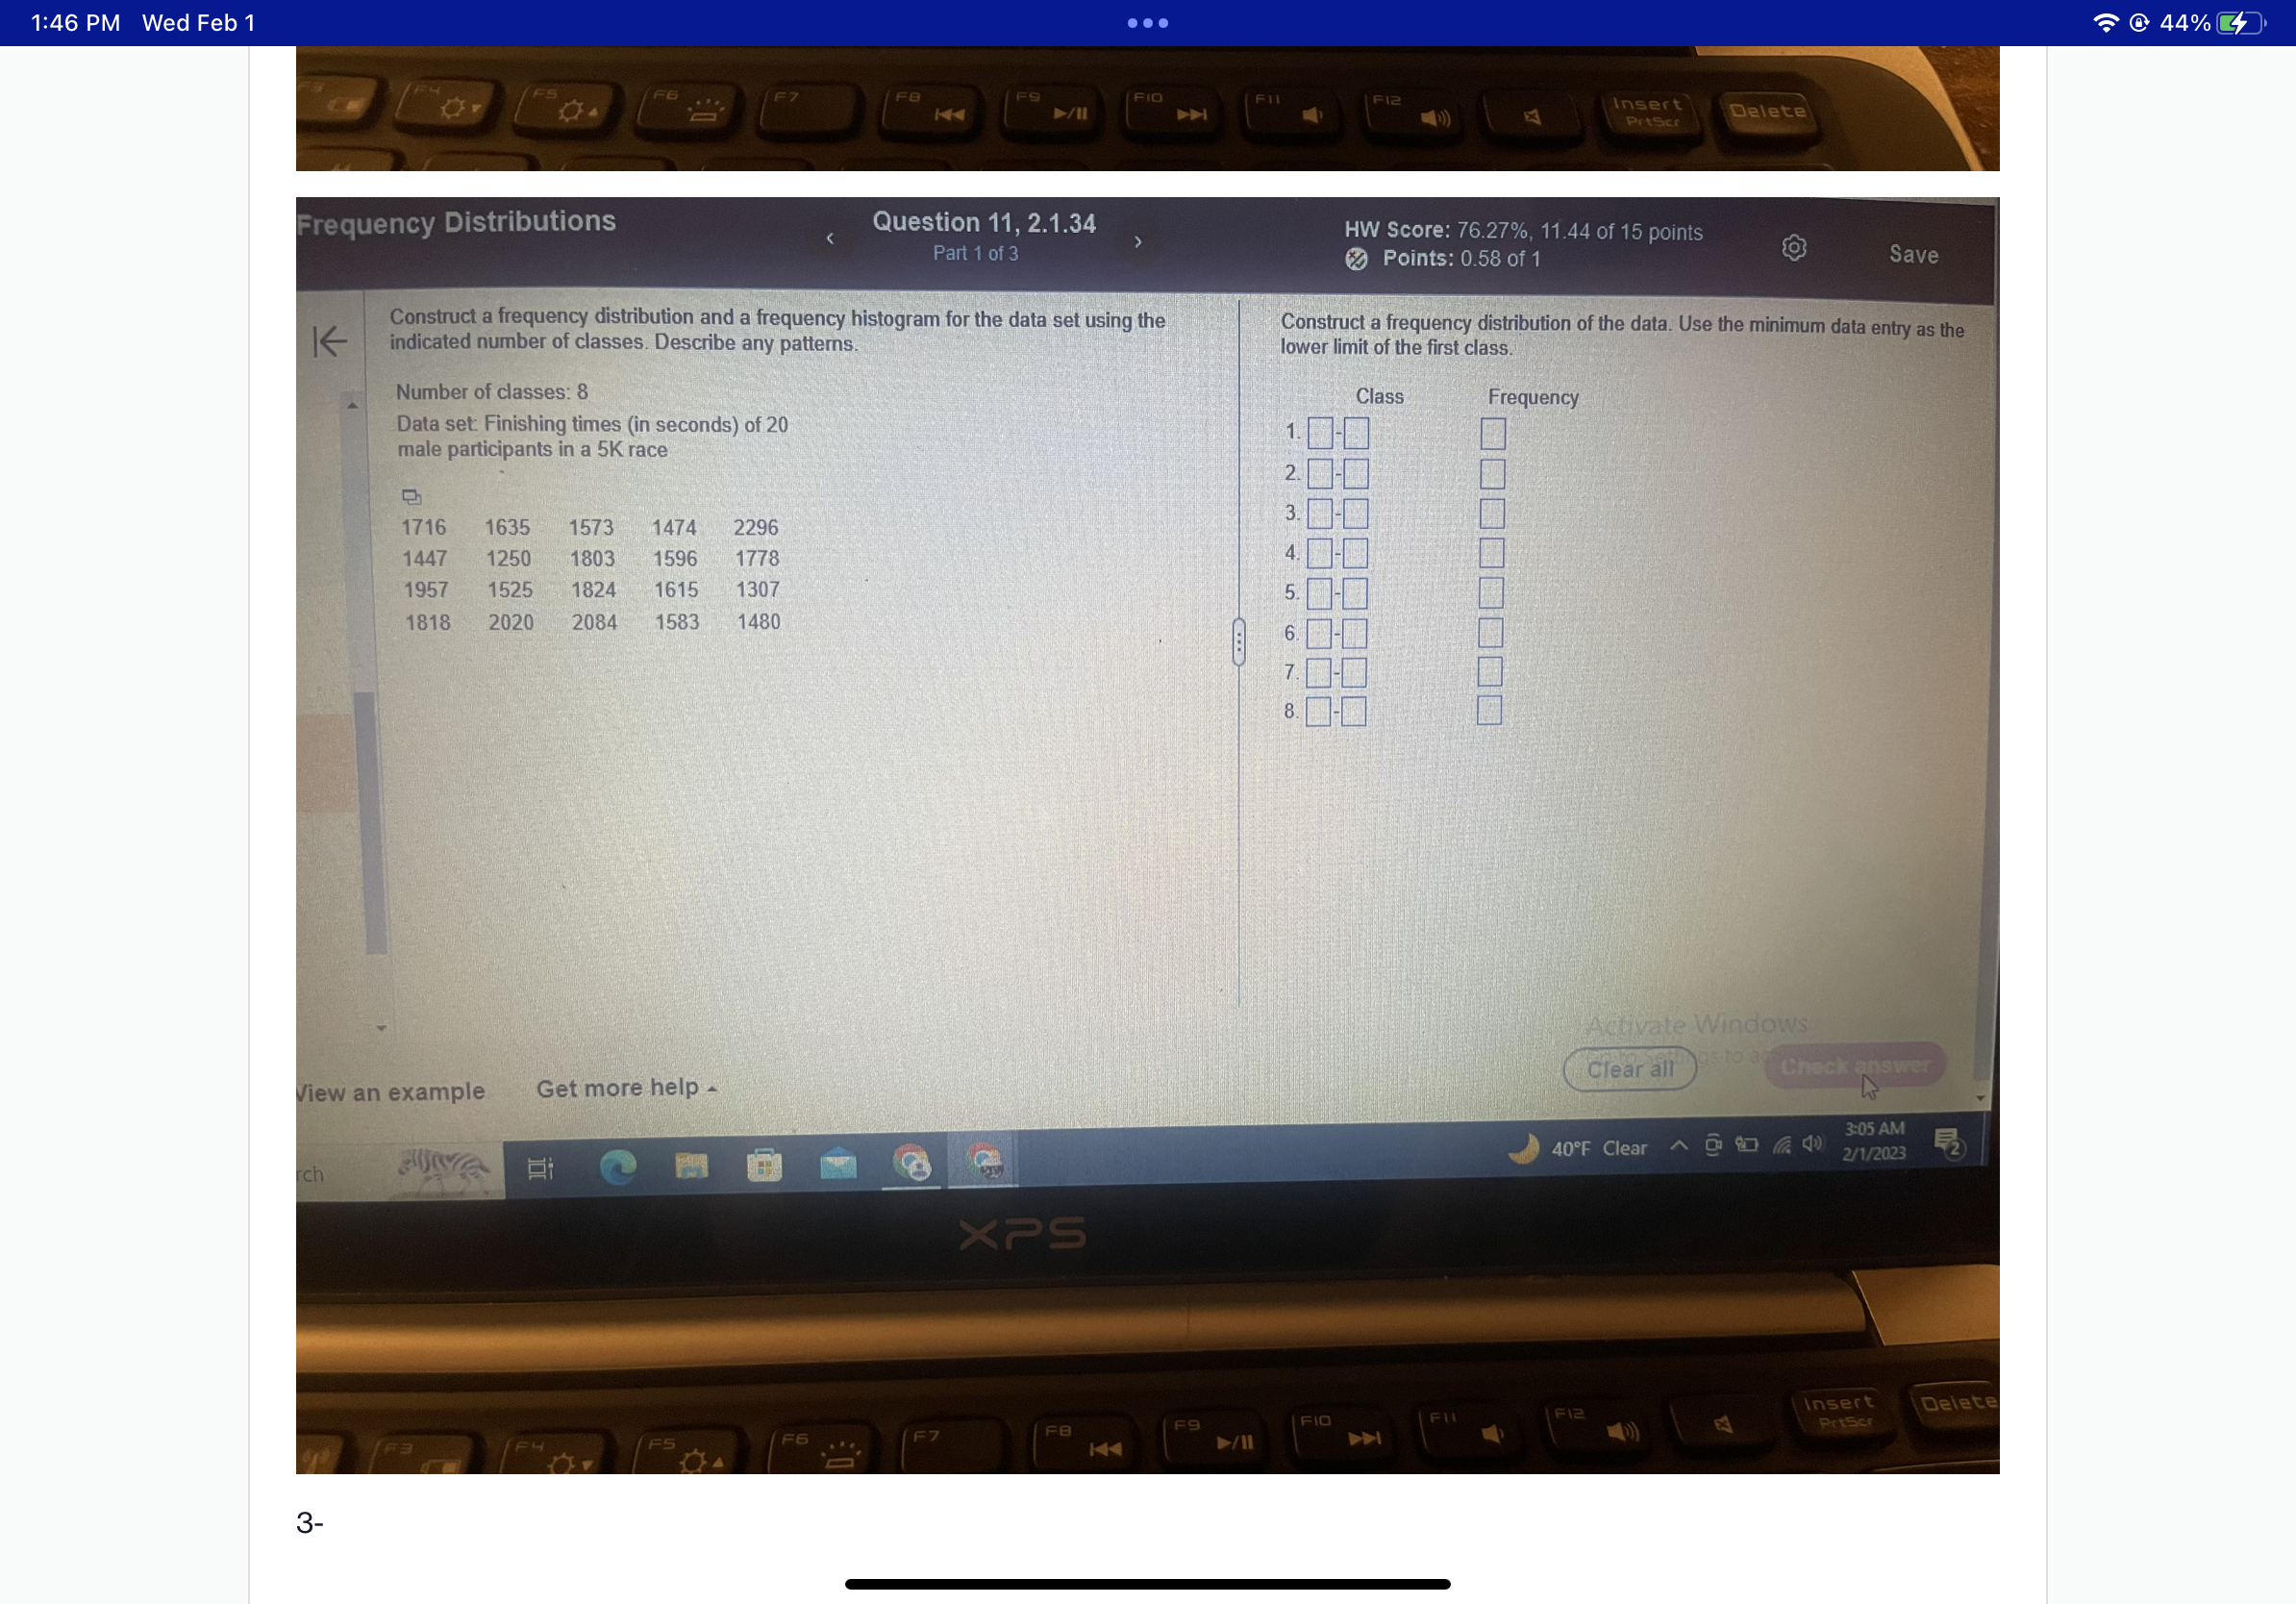
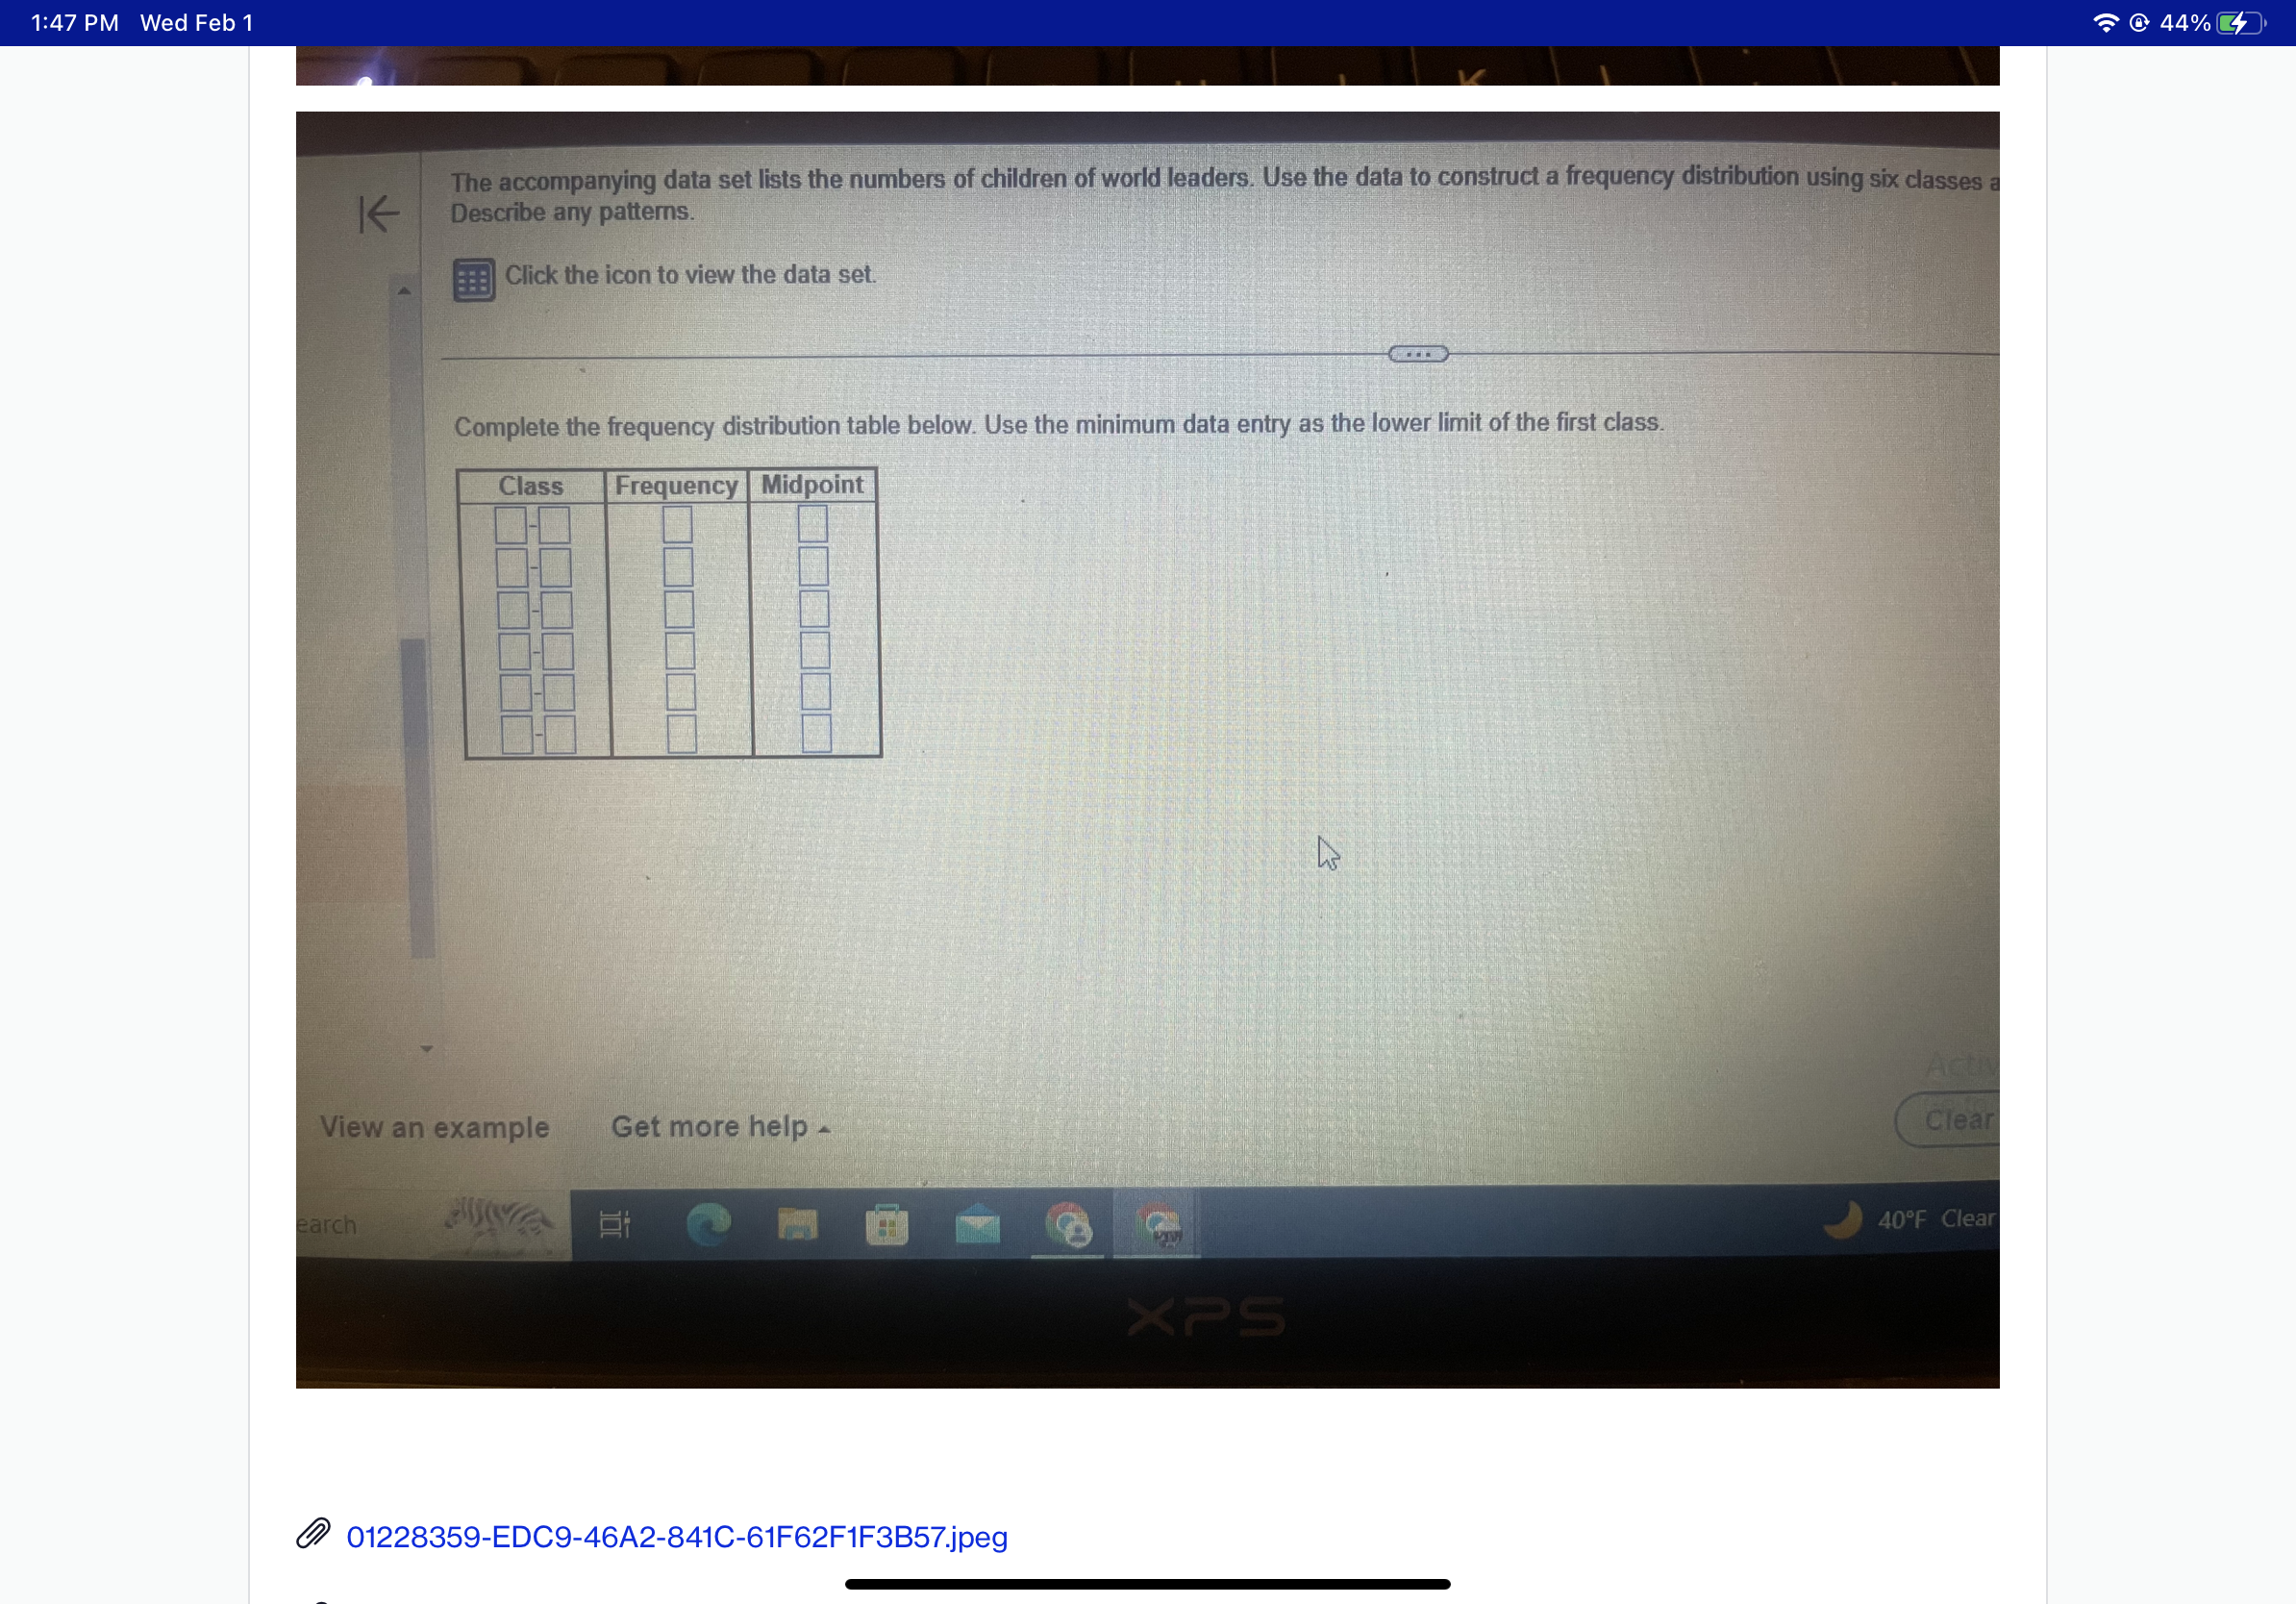
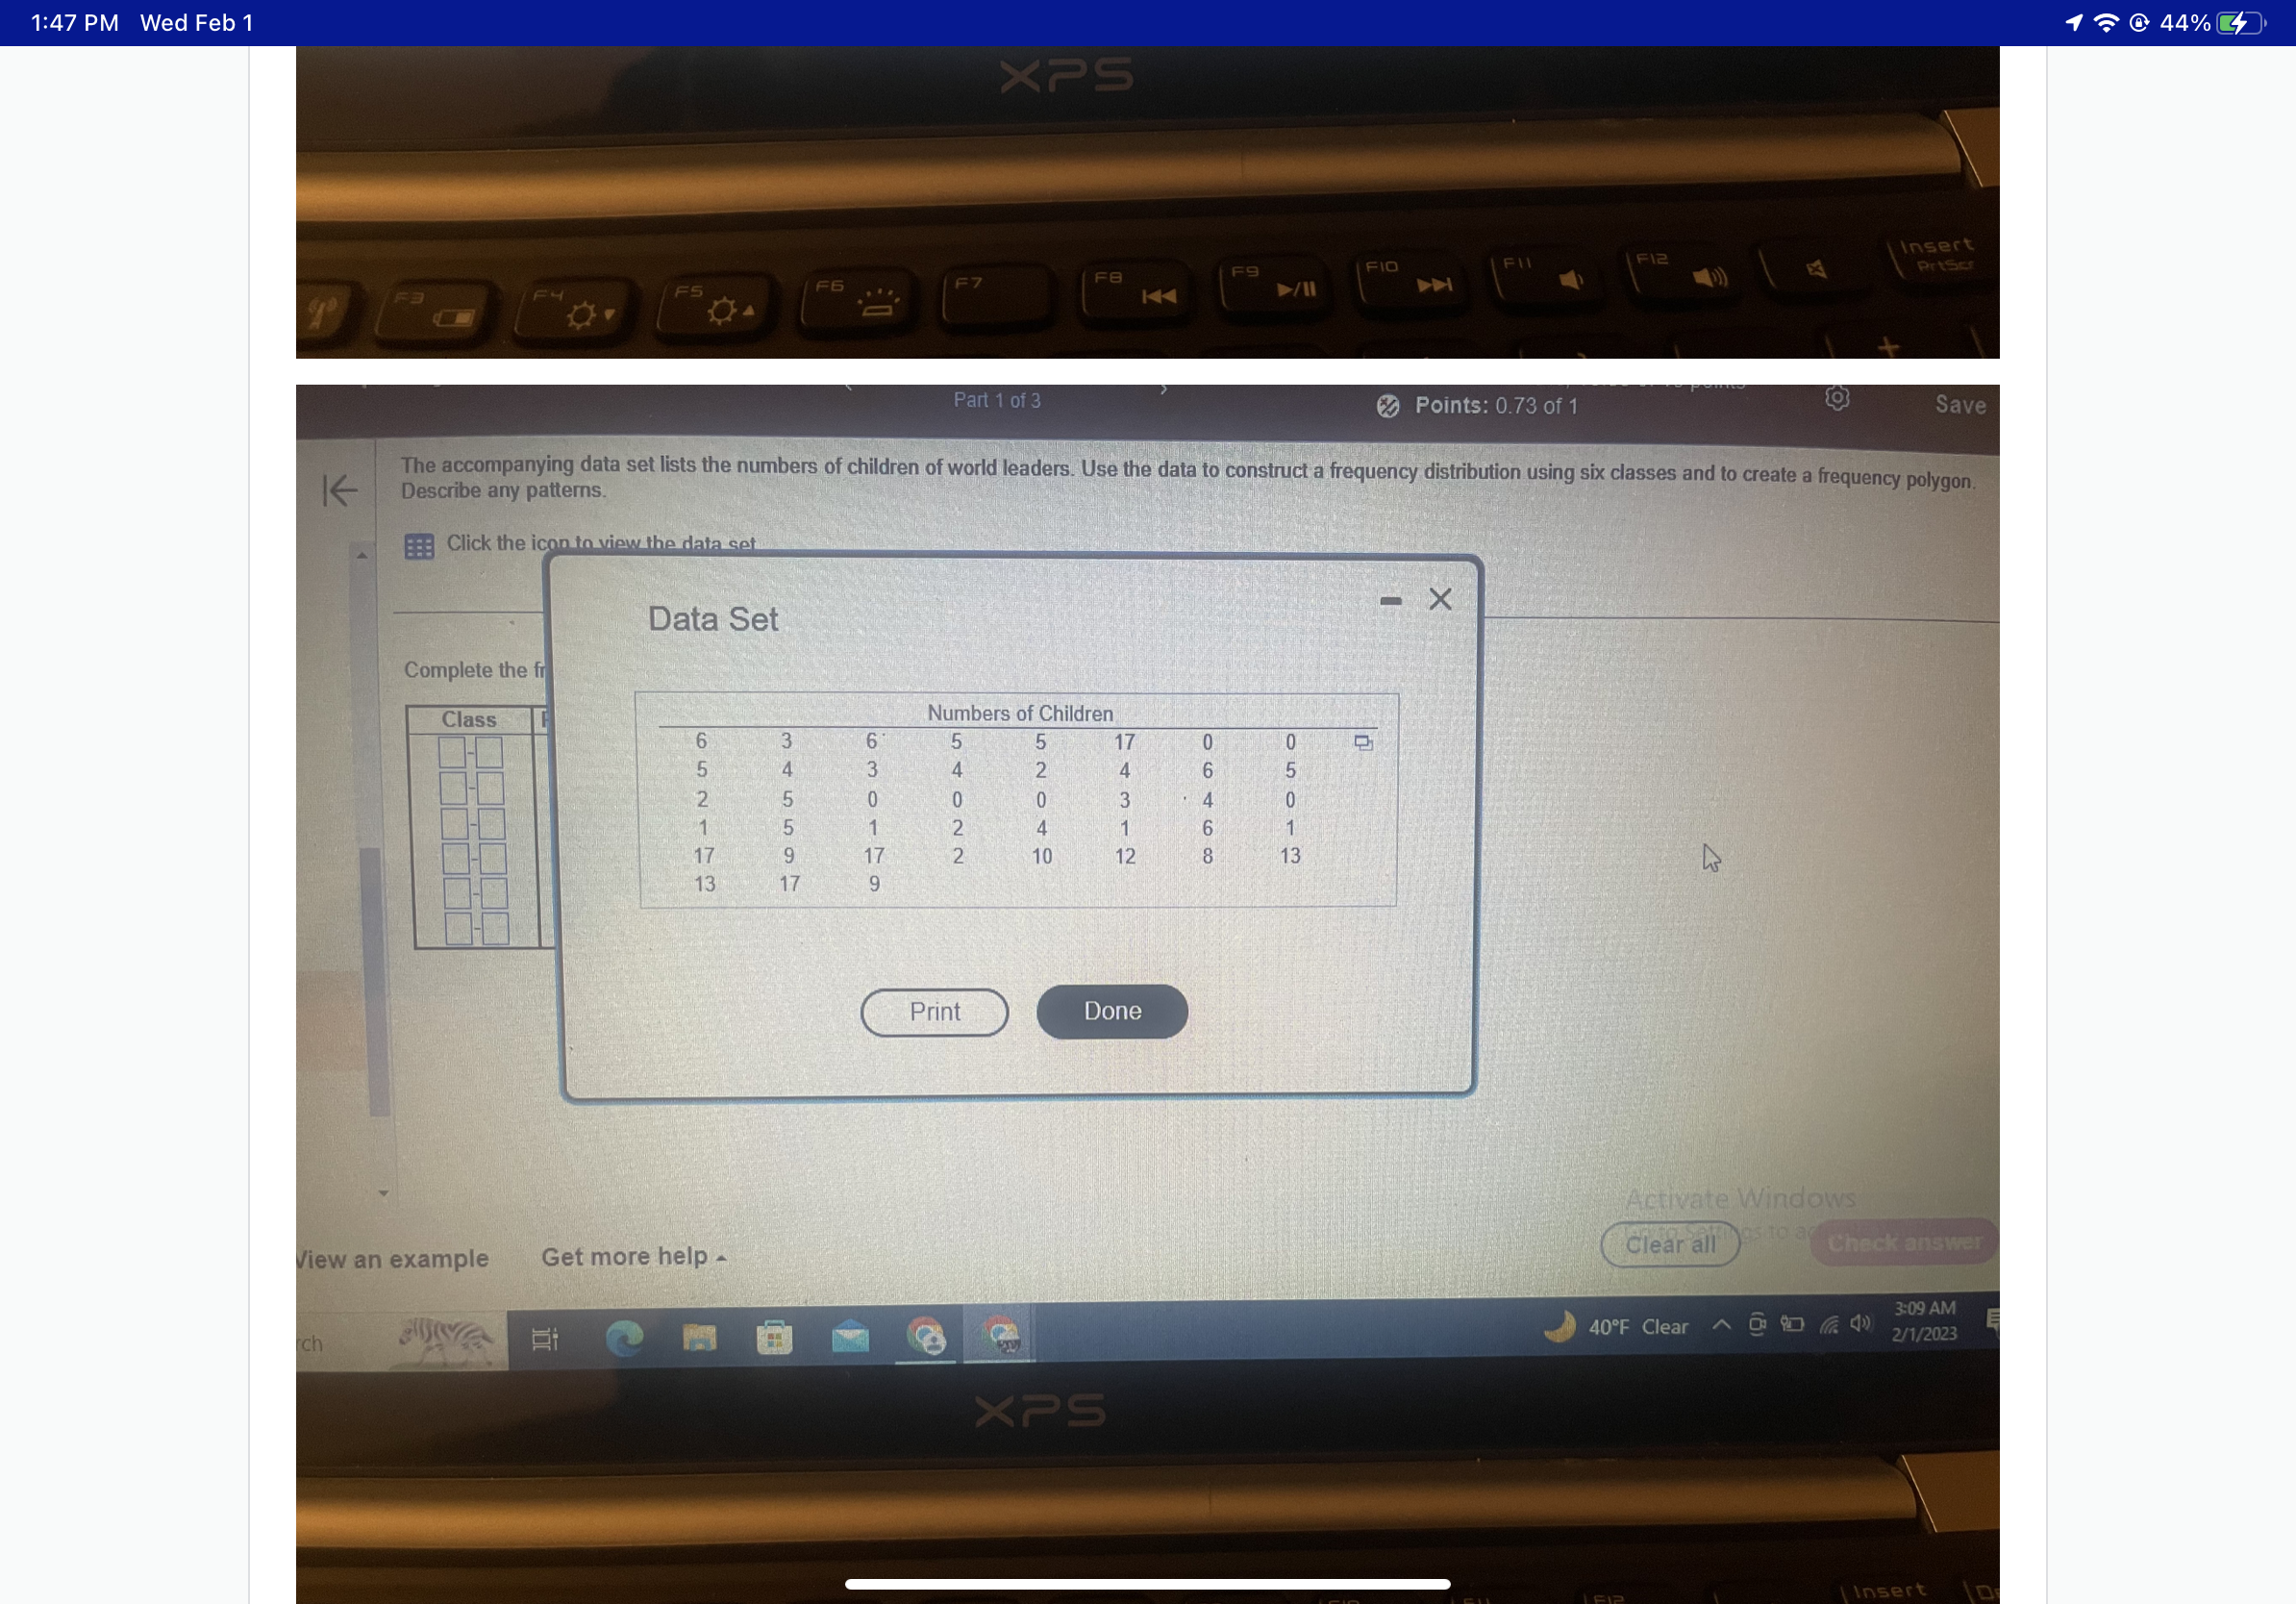
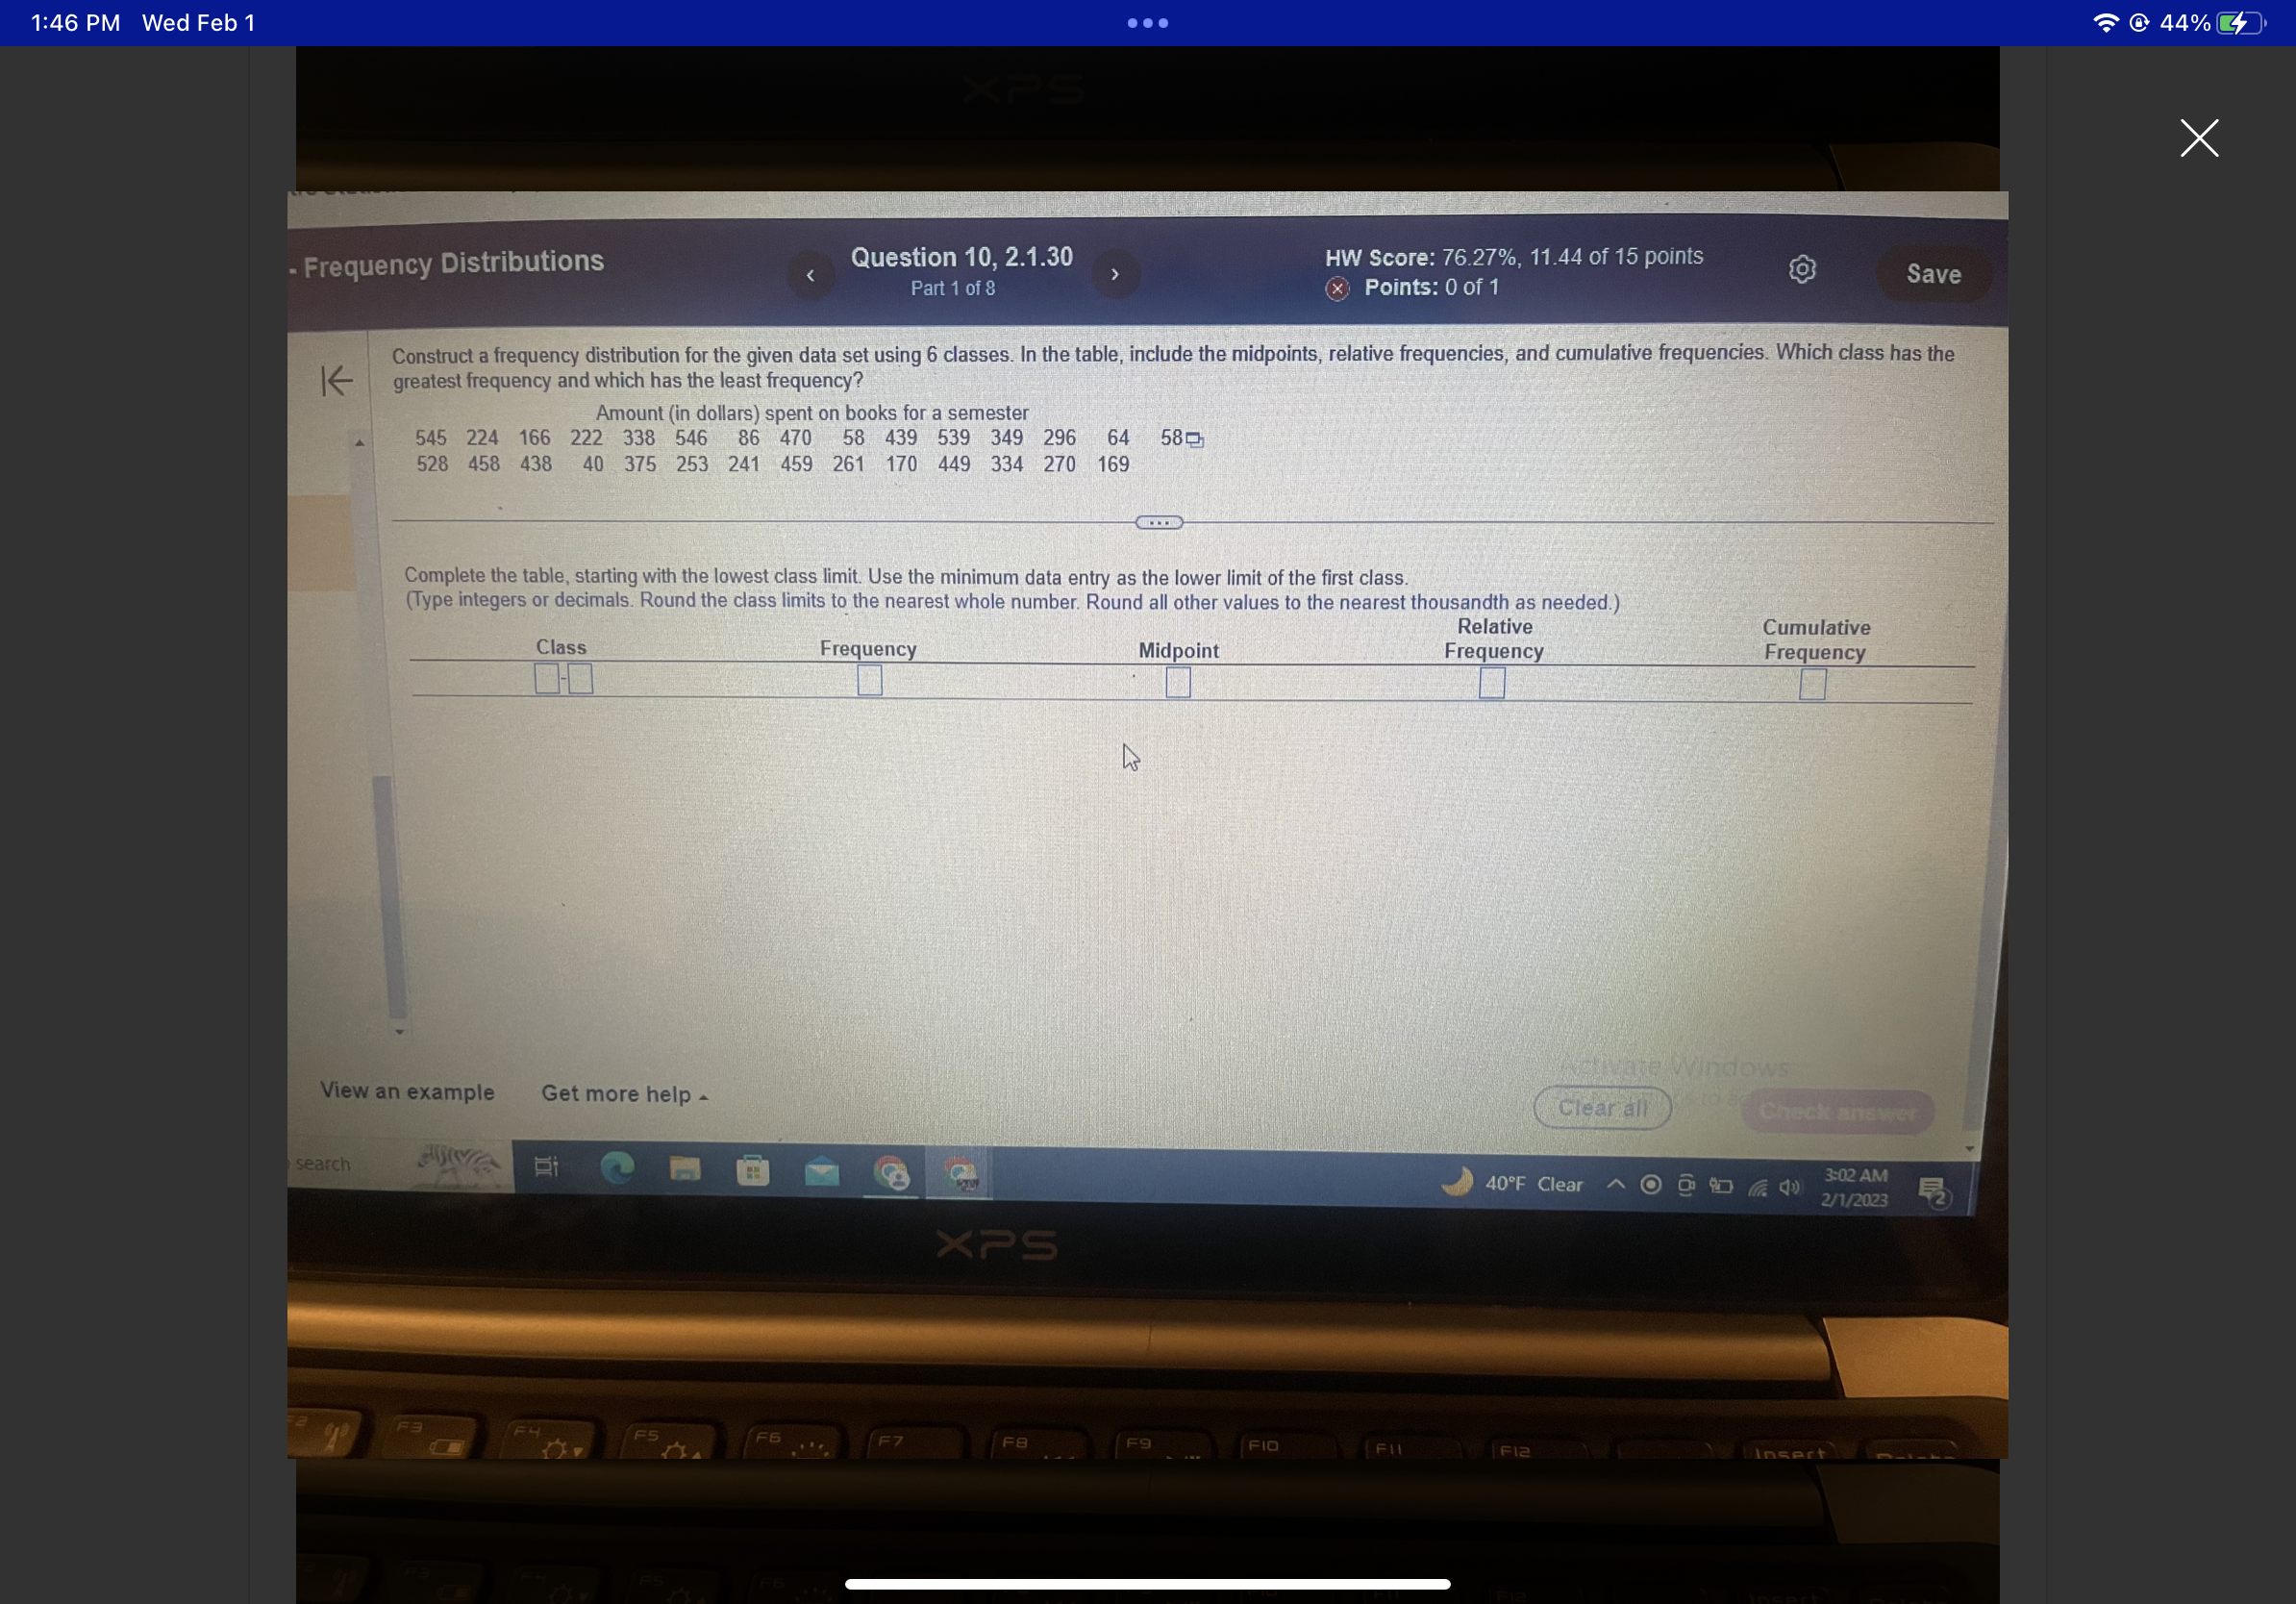
Question: Please help me with the 3 questions 1- 1:46 PM Wed Feb 1 @ 44% 144 K4 FII Fle Insect Prther Delete Frequency Distributions Question

Please help me with the 3 questions 1-

Please help me with the 3 questions 1- 1:46 PMPlease help me with the 3 questions 1- 1:46 PMPlease help me with the 3 questions 1- 1:46 PMPlease help me with the 3 questions 1- 1:46 PM
1:46 PM Wed Feb 1 @ 44% 144 K4 FII Fle Insect Prther Delete Frequency Distributions Question 11, 2.1.34 HW Score: 76.27%, 11.44 of 15 points Part 1 of 3 Points: 0.58 of 1 Save K Construct a frequency distribution and a frequency histogram for the data set using the indicated number of classes. Describe any patterns. Construct a frequency distribution of the data. Use the minimum data entry as the lower limit of the first class. Number of classes: 8 Class Frequency Data set: Finishing times (in seconds) of 20 male participants in a 5K race 1716 1635 1573 1474 2296 3. 1447 1250 1803 1596 1778 1957 1525 1824 1615 1307 1818 2020 2084 1583 1480 Activate Windows s.to a View an example Get more help . Clear all Check answer 40 F Clear ~ : ) ( 4) 3:05 AM ch 2/1/2023 XPS Insert Delete 5 .... F7 FB Prefer 3-1:47 PM Wed Feb 1 @ 44% The accompanying data set lists the numbers of children of world leaders. Use the data to construct a frequency distribution using six classes K Describe any patterns. ETE Click the icon to view the data set. Complete the frequency distribution table below. Use the minimum data entry as the lower limit of the first class. Class Frequency| Midpoint View an example Get more help - Clear earch 40 F Clear XPS 01228359-EDC9-46A2-841C-61F62F1F3B57.jpeg1:47 PM Wed Feb 1 1 44% XPS FIO FII F12 Insert F6 F7 PrtScr K KA Part 1 of 3 Points: 0.73 of 1 Save K Describe any patterns. The accompanying data set lists the numbers of children of world leaders. Use the data to construct a frequency distribution using six classes and to create a frequency polygon. EEE Click the icon to view the data set Data Set X Complete the fr Class Numbers of Children OfONU NNOA Howa Print Done Activate Windows View an example Get more help - Clear all Check answe 3:09 AM ch 40OF Clear ~ 9: ) ( 4) 2/1/2023 XPS1:46 PM Wed Feb 1 @ 44% X - Frequency Distributions Question 10, 2.1.30 HW Score: 76.27%, 11.44 of 15 points Save Part 1 of 8 x Points: 0 of 1 Construct a frequency distribution for the given data set using 6 classes. In the table, include the midpoints, relative frequencies, and cumulative frequencies. Which class has the K greatest frequency and which has the least frequency? Amount (in dollars) spent on books for a semester 545 224 166 222 338 546 86 470 58 439 539 349 296 64 58 528 458 438 40 375 253 241 459 261 170 449 334 270 169 Complete the table, starting with the lowest class limit. Use the minimum data entry as the lower limit of the first class. (Type integers or decimals. Round the class limits to the nearest whole number. Round all other values to the nearest thousandth as needed.) Relative Cumulative Class Frequency Midpoint Frequency Frequency the Windows View an example Get more help - Clear all Check answer search M 40OF Clear 3:02 AM 2/1/2023 XPS F6 ... F7 FB F9 . ... FIO F12 Insert

Step by Step Solution

There are 3 Steps involved in it

1 Expert Approved Answer
Step: 1 Unlock blur-text-image
Question Has Been Solved by an Expert!

Get step-by-step solutions from verified subject matter experts

Step: 2 Unlock
Step: 3 Unlock

Students Have Also Explored These Related Mathematics Questions!