

Question: please help me with the calculations in this mean & range chart problem! will like for work!!! ( the first number-second line factors for R
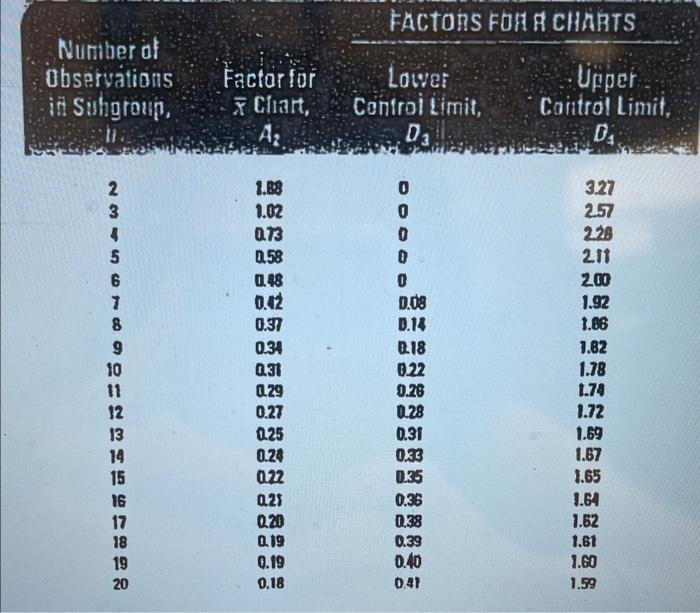
please help me with the calculations in this mean & range chart problem! will like for work!!! ( the first number-second line "factors for R charts" is 1.88 & the fifth/ sixth is 0.48, 0.42 if you had a hard time reading them) 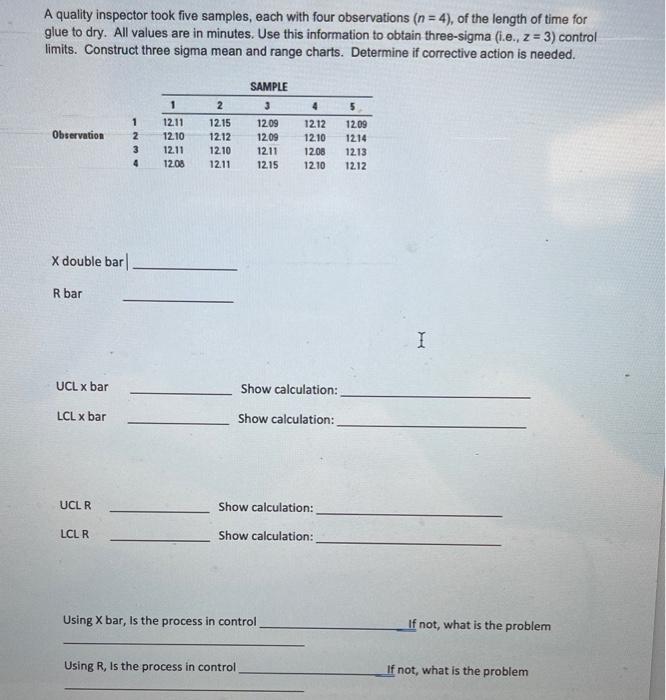
A quality inspector took five samples, each with four observations (n=4), of the length of time for glue to dry. All values are in minutes. Use this information to obtain three-sigma (i.e., z=3 ) control limits. Construct three sigma mean and range charts. Determine if corrective action is needed. x double bar R bar UCL x bar Show calculation: LCL bar Show calculation: UCL R Show calculation: LCL R Show calculation: Using X bar, Is the process in control If not, what is the problem Using R, Is the process in control If not, what is the
Step by Step Solution
There are 3 Steps involved in it
1 Expert Approved Answer
Step: 1 Unlock

Question Has Been Solved by an Expert!
Get step-by-step solutions from verified subject matter experts
Step: 2 Unlock
Step: 3 Unlock