

Question: please help me with the code (python)for questions 3 and 4. The previous images help with three and four Multiple sclerosis (MS) involves an immune-mediated
please help me with the code (python)for questions 3 and 4. The previous images help with three and four
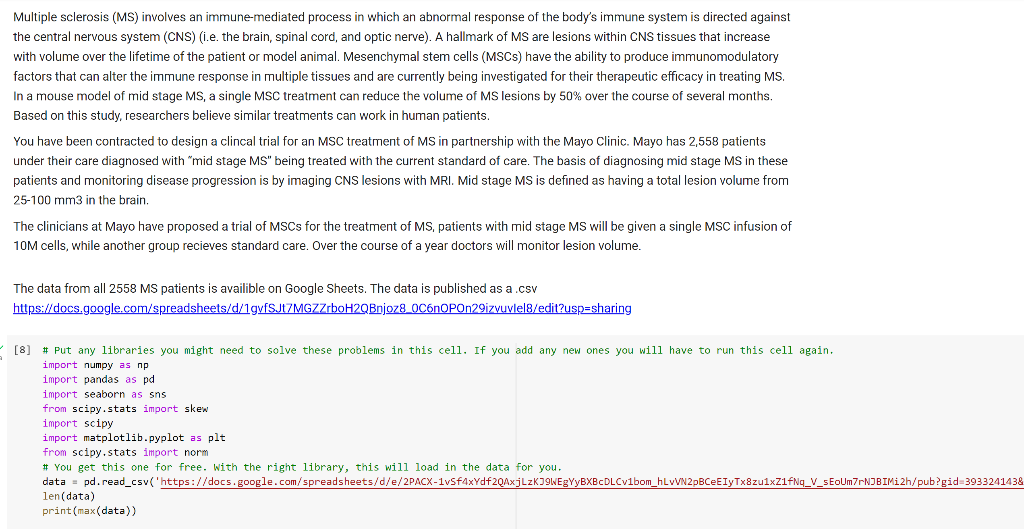
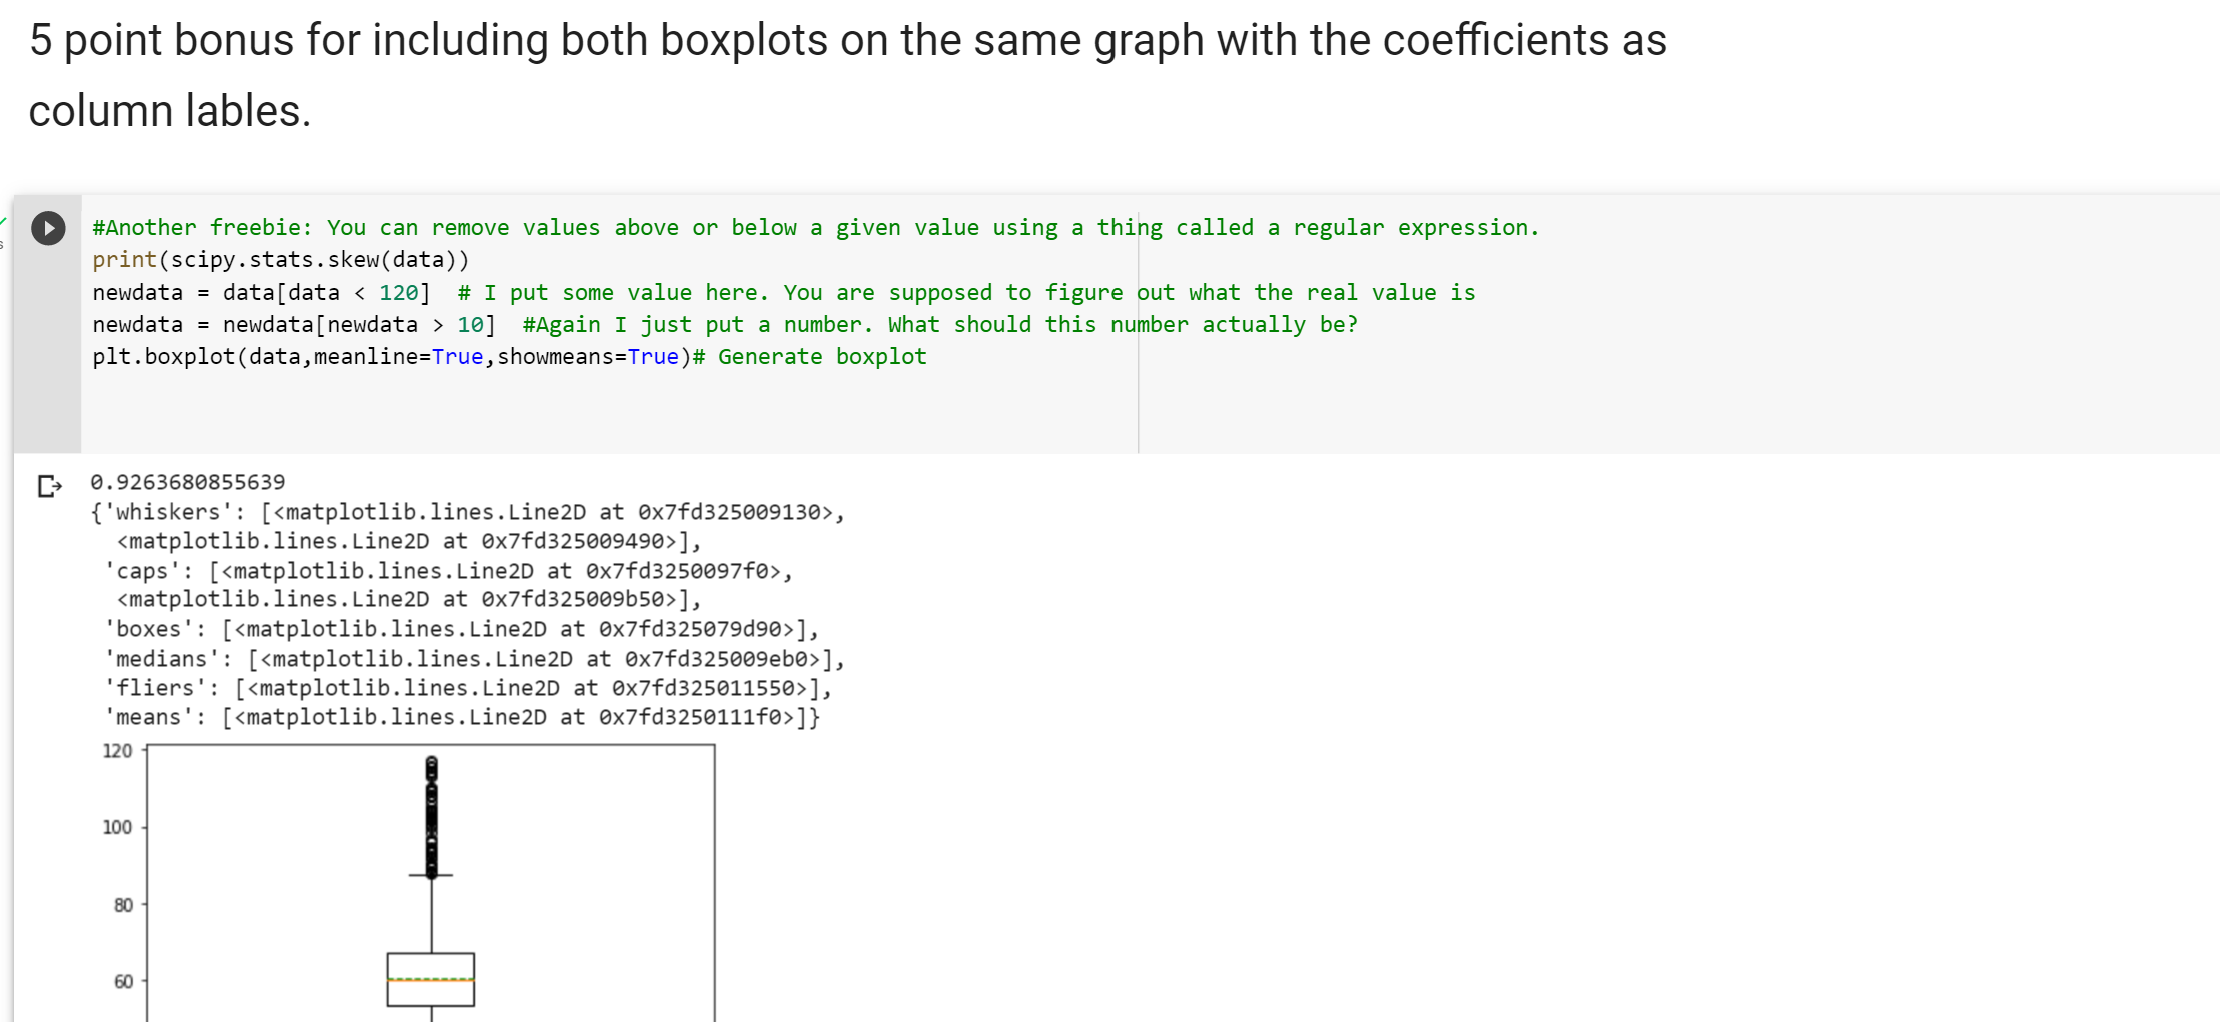
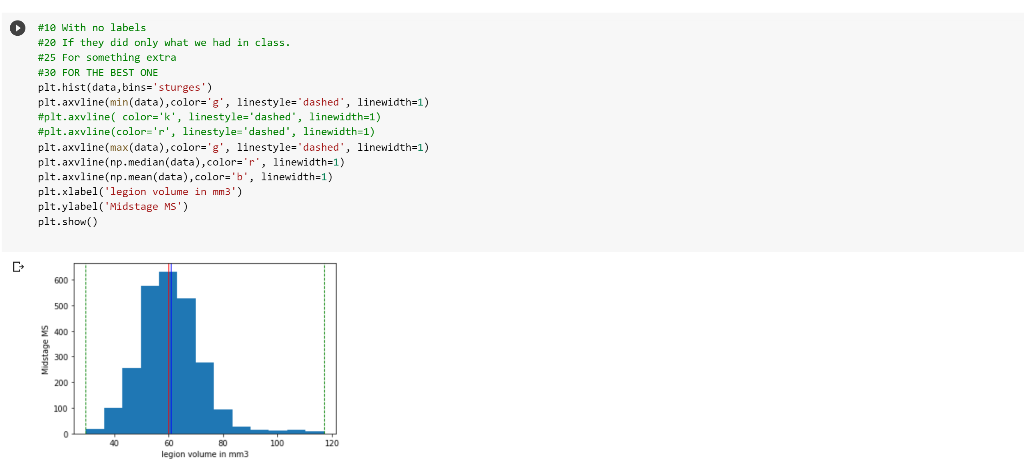
Multiple sclerosis (MS) involves an immune-mediated process in which an abnormal response of the body's immune system is directed against the central nervous system (CNS) (i.e. the brain, spinal cord, and optic nerve). A hallmark of MS are lesions within CNS tissues that increase with volume over the lifetime of the patient or model animal. Mesenchymal stem cells (MSCs) have the ability to produce immunomodulatory factors that can alter the immune response in multiple tissues and are currently being investigated for their therapeutic efficacy in treating MS. In a mouse model of mid stage MS, a single MSC treatment can reduce the volume of MS lesions by 50\% over the course of several months. Based on this study, researchers believe similar treatments can work in human patients. You have been contracted to design a clincal trial for an MSC treatment of MS in partnership with the Mayo Clinic. Mayo has 2,558 patients under their care diagnosed with "mid stage MS" being treated with the current standard of care. The basis of diagnosing mid stage MS in these patients and monitoring disease progression is by imaging CNS lesions with MRI. Mid stage MS is defined as having a total lesion volume from 25-100 mm3 in the brain. The clinicians at Mayo have proposed a trial of MSCs for the treatment of MS, patients with mid stage MS will be given a single MSC infusion of 10M cells, while another group recieves standard care. Over the course of a year doctors will monitor lesion volume. The data from all 2558 MS patients is availible on Google Sheets. The data is published as a .csv https://docs.google.com/spreadsheets/d/1gufSJt7MGZZrboH2QBnjoz8_oC6noPOn29izvuvlel8/edit?usp=sharing [8] \# Put any libraries you might need to solve these problems in this cell. If you add any new ones you will have to run this cell again. import numpy as np import pandas as pd import seaborn as sns from scipy.stats import skew import scipy import matplotlib.pyplot as plt from scipy, stats import norm \# You get this one for free. With the right library, this will load in the data for you. len (data) print (max( data )) 2. (20pts) The clinicians are concerned that the data is skewed and have asked you to exclude patients based on the trial parameters. Based on your careful reading of how they have designed the trial, are there any patients who could be exluded from the study? Generate a boxplot of all patient data provide a coefficient of skew as the x-axis label. Generate a new dataset with excluded values. Generate a second boxplot of your new dataset with the new coefficient of skew as the x axis label. 5 point bonus for including both boxplots on the same graph with the coefficients as column lables. 3. (20pts) What are the minimum and maximum percentiles that you are removing with your new data? (For example if you removed all the data below the mean, you would be removing 50% of your data. What % are you removing from each end?) Show your code and print the values. PART2: The data used to recruit patients is not current and all subjects will have to be given an new MRI and have their lesion volumes re-measured before starting the trial. In an initial consultation before doing the big experiment, you have sampled 49 human MS patients and determined the mean lesion size to be 60+/4mm3. Double-click (or enter) to edit 4. (10 pts) What is the 90% confidence interval for the mean lesion volume Plot distribution of the population with lines showing the standard deviation value in a figure legend. 5 point bonus for including both boxplots on the same graph with the coefficients as column lables. \#Another freebie: You can remove values above or below a given value using a thing called a regular expression. print(scipy.stats. skew (data)) newdata = data [ data ] \# I put some value here. You are supposed to figure out what the real value is newdata = newdata[newdata > 10 ] \#Again I just put a number. What should this number actually be? plt. boxplot (data, meanline=True, showmeans=True) \# Generate boxplot \#10 With no labels \#20 If they did only what we had in class. \#25 For something extra \#38 FOR THE BEST ONE plt.hist(data, bins= 'sturges') plt.axvline (min(data), color = 'g', linestyle = " dashed ', linewidth=1) \#plt.axvline ( color=' k ', linestyle='dashed ", linewidth=1) \#plt.axvline(color='r', linestyle='dashed", linewidth=1) plt.axvline (max (data), color ='g', linestyle = 'dashed , linewidth=1) plt. axvline (np, median(data), color =r, linewidth=1) plt.axvline (np.mean(data), color=' b, linewidth=1) plt.xlabel('legion volume in mm3') plt.ylabel ('Midstage MS') plt.show()
Step by Step Solution
There are 3 Steps involved in it

Get step-by-step solutions from verified subject matter experts