

Question: Please help me with the following math statistics problems. I believe the category falls under statistics but it could be calculus or algebra too. Thank
Please help me with the following math statistics problems. I believe the category falls under statistics but it could be calculus or algebra too. Thank you.
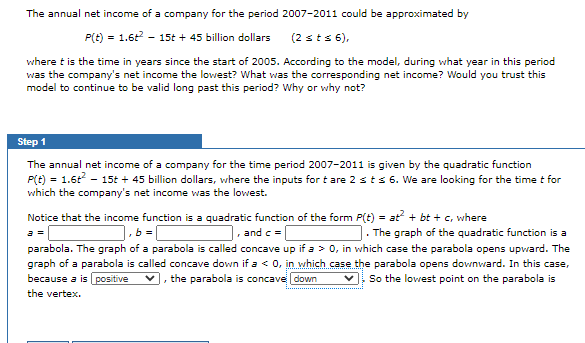


The annual net income of a company for the period 2007-2011 could be approximated by P(t) = 1.6t - 15t + 45 billion dollars (2st= 6), where t is the time in years since the start of 2005. According to the model, during what year in this period was the company's net income the lowest? What was the corresponding net income? Would you trust this model to continue to be valid long past this period? Why or why not? Step 1 The annual net income of a company for the time period 2007-2011 is given by the quadratic function P(t) = 1.6t - 15t + 45 billion dollars, where the inputs for t are 2 s t s 6. We are looking for the time t for which the company's net income was the lowest. Notice that the income function is a quadratic function of the form P(t) = at + bt + c, where , b = . and c = . The graph of the quadratic function is a parabola. The graph of a parabola is called concave up if = > 0, in which case the parabola opens upward. The graph of a parabola is called concave down if a
Step by Step Solution
There are 3 Steps involved in it

Get step-by-step solutions from verified subject matter experts