

Question: Please help me with the graphs and a small description about each. Thank u (Rey-Osterrieth) Make a bar graph of the average # errors in
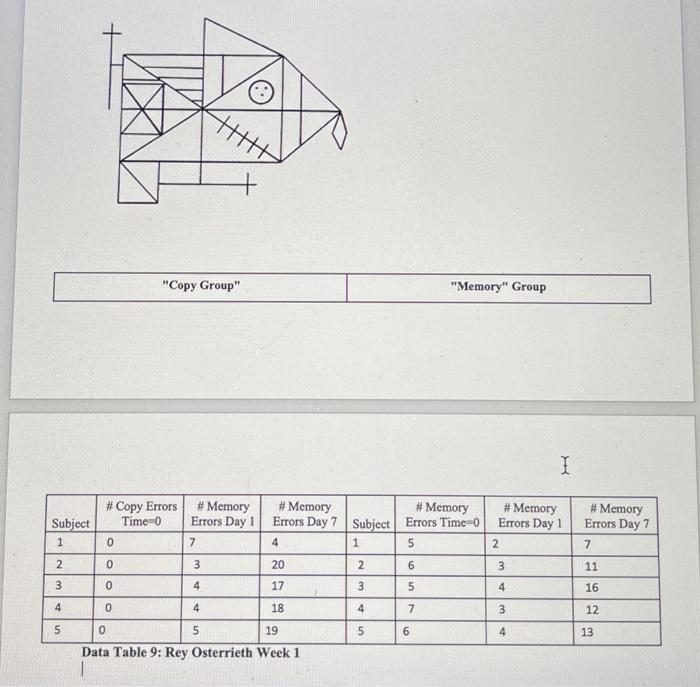
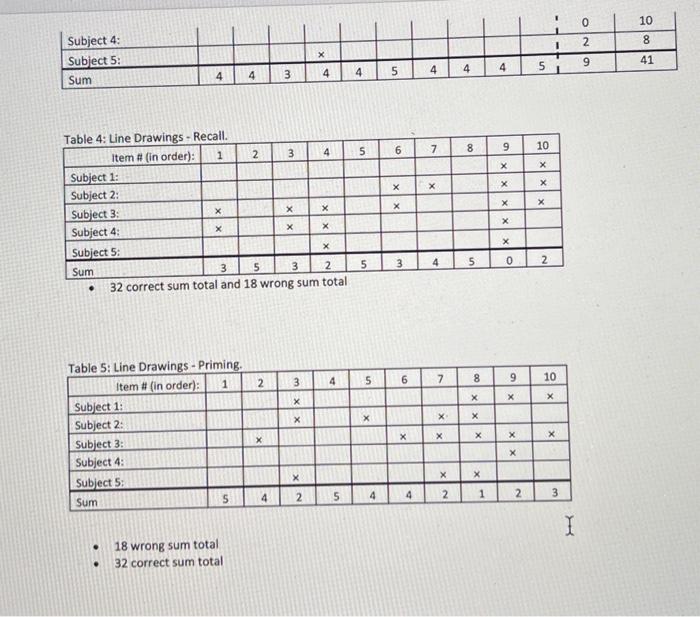
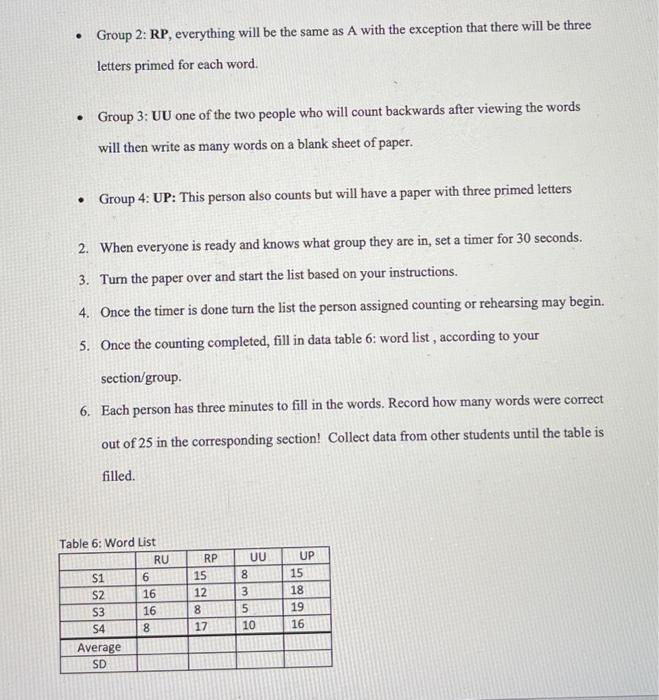
(Rey-Osterrieth) Make a bar graph of the average # errors in the Rey-Osterrieth Complex Figure Test. There should be six bars one for each condition.
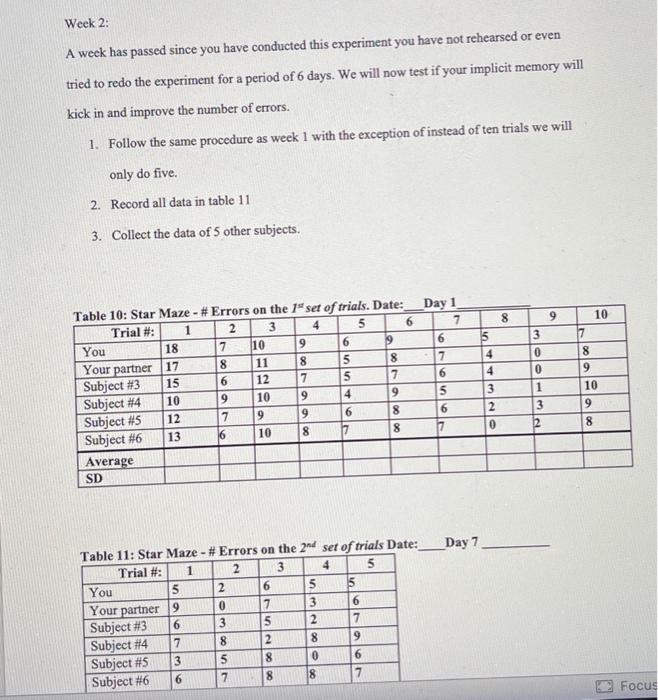
(Star) Make a line graph of the average number of errors on the star tracing experiment from your averaged class data for both dates (time = 0, Table 10 and time = 7 (or 14) days) on the same graph.
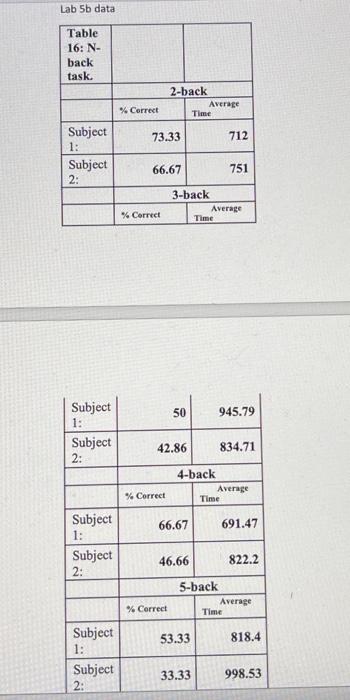
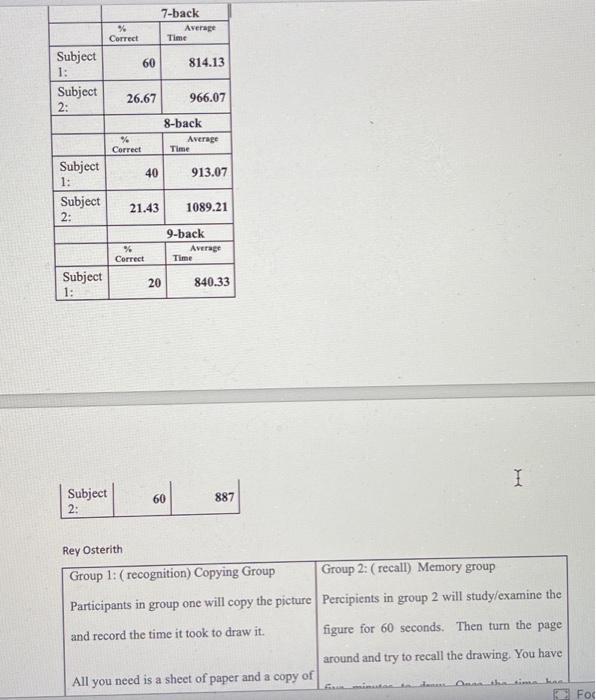
(N-Back) Make 2 line graphs. One should be the % correct and the other should be of the average time, as interference increases.
(Morris water maze) Make a line graph of the latency to the platform. Be sure to indicate on the graph what type of trial each represents. You should have 2 lines one for each table.
Step by Step Solution
There are 3 Steps involved in it

Get step-by-step solutions from verified subject matter experts