

Question: PLEASE HELP ME WITH THE ONES IN RED Problem 5-43 (Algo) Cost of Idle Capacity [LO 5-1, 5-3, 5-4] Coffee Bean Incorporated (CBI) processes and
![Cost of Idle Capacity [LO 5-1, 5-3, 5-4] Coffee Bean Incorporated (CBI)](https://dsd5zvtm8ll6.cloudfront.net/si.experts.images/questions/2024/10/67166df734374_19067166df6a6de8.jpg)
PLEASE HELP ME WITH THE ONES IN RED
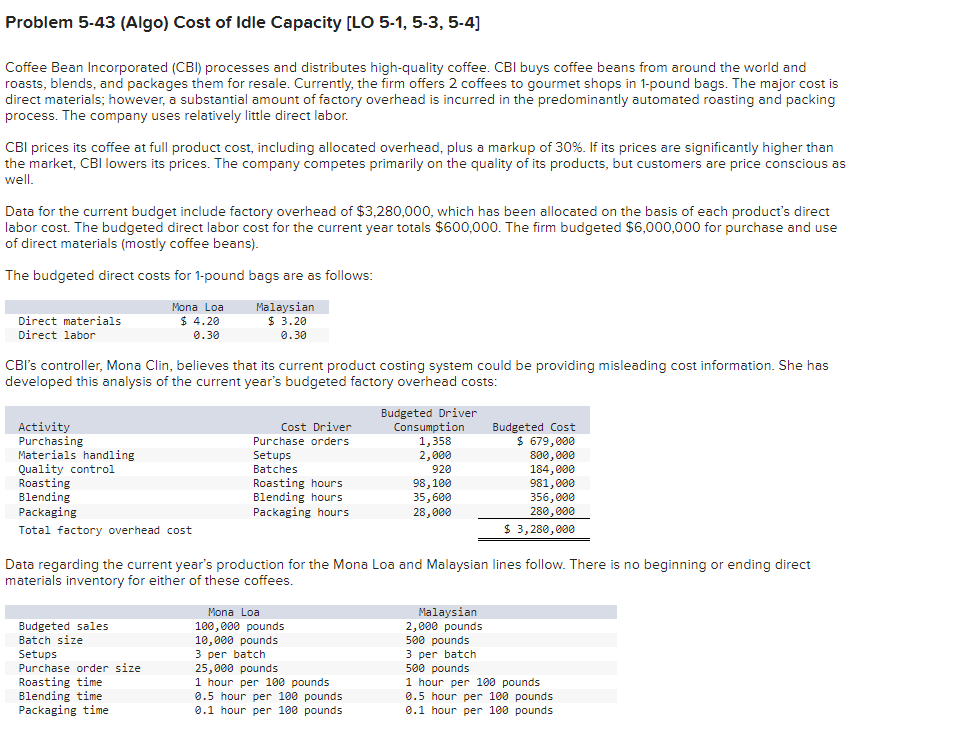
Problem 5-43 (Algo) Cost of Idle Capacity [LO 5-1, 5-3, 5-4] Coffee Bean Incorporated (CBI) processes and distributes high-quality coffee. CBI buys coffee beans from around the world and roasts, blends, and packages them for resale. Currently, the firm offers 2 coffees to gourmet shops in 1-pound bags. The major cost is direct materials; however, a substantial amount of factory overhead is incurred in the predominantly automated roasting and packing process. The company uses relatively little direct labor. CBI prices its coffee at full product cost, including allocated overhead, plus a markup of 30%. If its prices are significantly higher than the market, CBI lowers its prices. The company competes primarily on the quality of its products, but customers are price conscious as well. Data for the current budget include factory overhead of $3,280,000, which has been allocated on the basis of each product's direct labor cost. The budgeted direct labor cost for the current year totals $600,000. The firm budgeted $6,000,000 for purchase and use of direct materials (mostly coffee beans). The budgeted direct costs for 1-pound bags are as follows: Direct materials Direct labor Mona Loa $ 4.20 0.30 Malaysian $ 3.20 0.30 CBI's controller, Mona Clin, believes that its current product costing system could be providing misleading cost information. She has developed this analysis of the current year's budgeted factory overhead costs: Activity Purchasing Materials handling Quality control Roasting Blending Packaging Total factory overhead cost Cost Driver Purchase orders Setups Batches Roasting hours Blending hours Packaging hours Budgeted Driver Consumption 1,358 2,000 920 98,100 35,600 28,000 Budgeted Cost $ 679,000 800,000 184,000 981,000 356,000 280,000 $ 3,280,000 Data regarding the current year's production for the Mona Loa and Malaysian lines follow. There is no beginning or ending direct materials inventory for either of these coffees. Budgeted sales Batch size Setups Purchase order size Roasting time Blending time Packaging time Mona Loa 100,000 pounds 10,000 pounds 3 per batch 25,000 pounds 1 hour per 100 pounds 0.5 hour per 100 pounds 0.1 hour per 100 pounds Malaysian 2,000 pounds 500 pounds 3 per batch 500 pounds 1 hour per 100 pounds 0.5 hour per 100 pounds 0.1 hour per 100 pounds Data regarding the current year's production for the Mona Loa and Malaysian lines follow. There is no beginning or ending direct materials inventory for either of these coffees. Budgeted sales Batch size Setups Purchase order size Roasting time Blending time Packaging time Mona Loa 100,000 pounds 10,000 pounds 3 per batch 25,000 pounds 1 hour per 100 pounds 0.5 hour per 100 pounds 0.1 hour per 100 pounds Malaysian 2,000 pounds 500 pounds 3 per batch 500 pounds 1 hour per 100 pounds 0.5 hour per 100 pounds 0.1 hour per 100 pounds Coffee Bean has total practical capacity as noted in the table below, i.e. processing 1,800 purchase orders, 2,800 setups, etc. These are the levels of activity work that are sustainable. Activity Purchasing Materials handling Quality control Roasting Blending Packaging Practical Capacity 1,800 2,800 1,600 104,000 40,000 34,000 Required: 1. Determine the activity rates based on practical capacity and the cost of idle capacity for each activity. (Round "Usage%" and "Practical Capactity Rate" to 2 decimal places. For percentages.1234 = 12.34%.) * Answer is complete but not entirely correct. Activity Budgeted Activity Budgeted Cost Usage Usage % Based Rate Practical Capacity Rate Unused Capacity Idle Capacity Cost 500 25 X s $ $ $ 400 Purchasing Materials handling Quality control Roasting Blending Packaging 29 X $ 43 X $ Practical Capacity at Current Spending 1.800 2,800 1,600 104,000 40,000 34.000 1,358 2.000 920 98,100 35,600 28,000 200 $ 679,000 $ 800.000 $ 184,000 $ 981.000 $ 356,000 $ 280,000 $ 3,280,000 75.44% $ 71.43% s 57.50% S 94.33% S 89.00% S $ 82.35% $ 377.22 285.71 115.00 9.43 OOOOOO OOOOOO 10 6 xls S $ $ $ 221,000 X 320,000 X 136,000 X 59,000 X 44,000 X 60,000 X 840,000 10 10 8.90 8.23 11 * $ 18 X $ $
Step by Step Solution
There are 3 Steps involved in it

Get step-by-step solutions from verified subject matter experts