

Question: please help me with the R code of The part 2,3,4, i don't know how to put two data in one plot and use which
please help me with the R code of The part 2,3,4, i don't know how to put two data in one plot and use which kind of analysis
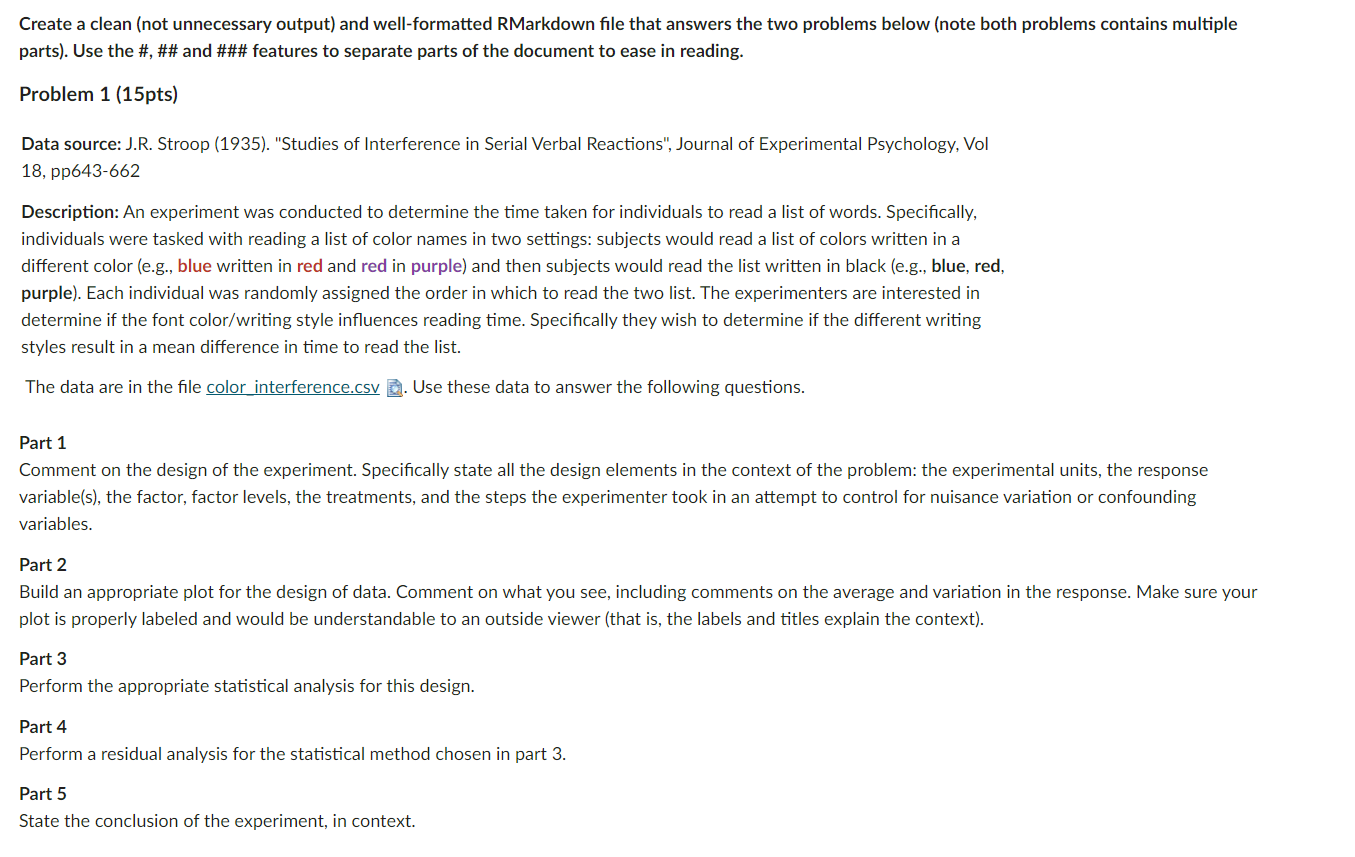
Create a clean (not unnecessary output) and well-formatted RMarkdown file that answers the two problems below (note both problems contains multiple parts). Use the #, ## and ### features to separate parts of the document to ease in reading. Problem 1 (15pts) Data source: J.R. Stroop (1935). "Studies of Interference in Serial Verbal Reactions", Journal of Experimental Psychology, Vol 18, pp643-662 Description: An experiment was conducted to determine the time taken for individuals to read a list of words. Specifically, individuals were tasked with reading a list of color names in two settings: subjects would read a list of colors written in a different color (e.g., blue written in red and red in purple) and then subjects would read the list written in black (e.g., blue, red, purple). Each individual was randomly assigned the order in which to read the two list. The experimenters are interested in determine if the font color/writing style influences reading time. Specifically they wish to determine if the different writing styles result in a mean difference in time to read the list. The data are in the file color interference.csv . Use these data to answer the following questions. Part 1 Comment on the design of the experiment. Specifically state all the design elements in the context of the problem: the experimental units, the response variable(s), the factor, factor levels, the treatments, and the steps the experimenter took in an attempt to control for nuisance variation or confounding variables. Part 2 Build an appropriate plot for the design of data. Comment on what you see, including comments on the average and variation in the response. Make sure your plot is properly labeled and would be understandable to an outside viewer (that is, the labels and titles explain the context). Part 3 Perform the appropriate statistical analysis for this design. Part 4 Perform a residual analysis for the statistical method chosen in part 3. Part 5 State the conclusion of the experiment, in context. Create a clean (not unnecessary output) and well-formatted RMarkdown file that answers the two problems below (note both problems contains multiple parts). Use the #, ## and ### features to separate parts of the document to ease in reading. Problem 1 (15pts) Data source: J.R. Stroop (1935). "Studies of Interference in Serial Verbal Reactions", Journal of Experimental Psychology, Vol 18, pp643-662 Description: An experiment was conducted to determine the time taken for individuals to read a list of words. Specifically, individuals were tasked with reading a list of color names in two settings: subjects would read a list of colors written in a different color (e.g., blue written in red and red in purple) and then subjects would read the list written in black (e.g., blue, red, purple). Each individual was randomly assigned the order in which to read the two list. The experimenters are interested in determine if the font color/writing style influences reading time. Specifically they wish to determine if the different writing styles result in a mean difference in time to read the list. The data are in the file color interference.csv . Use these data to answer the following questions. Part 1 Comment on the design of the experiment. Specifically state all the design elements in the context of the problem: the experimental units, the response variable(s), the factor, factor levels, the treatments, and the steps the experimenter took in an attempt to control for nuisance variation or confounding variables. Part 2 Build an appropriate plot for the design of data. Comment on what you see, including comments on the average and variation in the response. Make sure your plot is properly labeled and would be understandable to an outside viewer (that is, the labels and titles explain the context). Part 3 Perform the appropriate statistical analysis for this design. Part 4 Perform a residual analysis for the statistical method chosen in part 3. Part 5 State the conclusion of the experiment, in context
Step by Step Solution
There are 3 Steps involved in it

Get step-by-step solutions from verified subject matter experts