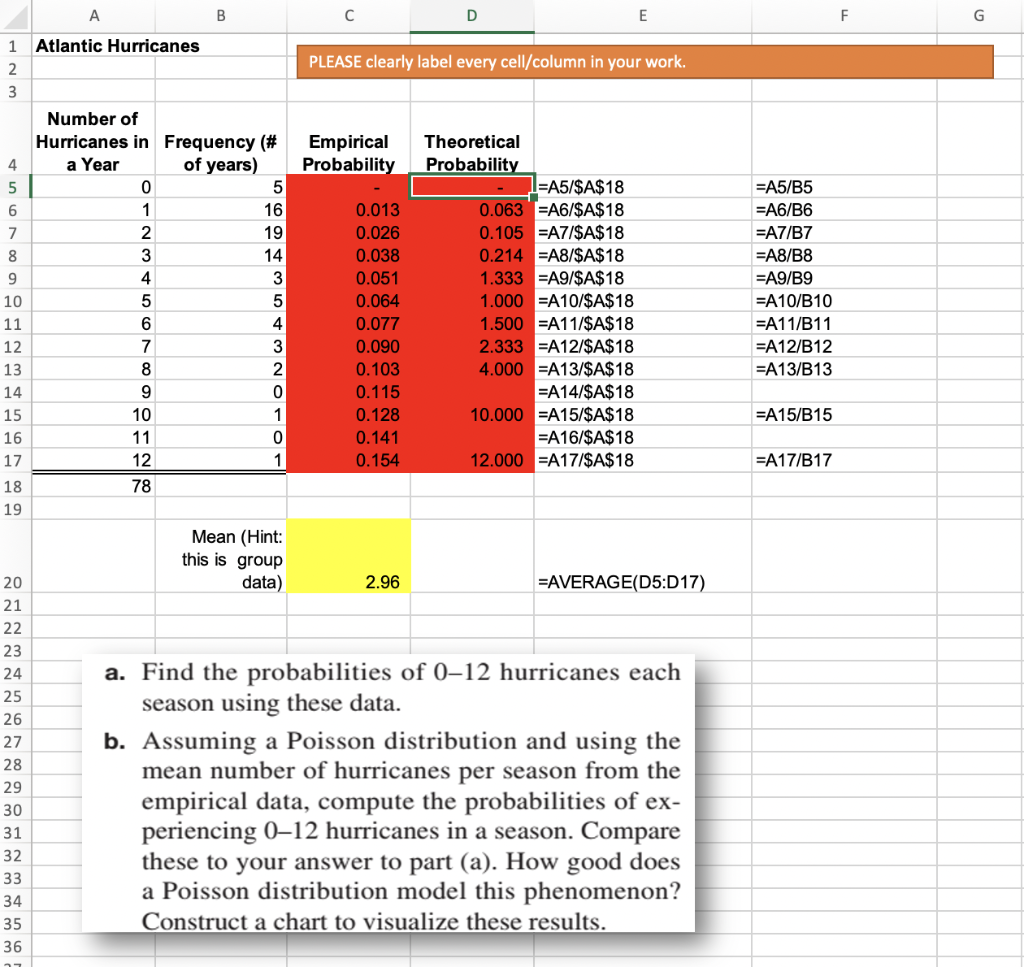
Question: Please help me with the red area! THANKS! A B D E F G Atlantic Hurricanes 1 2 3 PLEASE clearly label every cell/column in

Please help me with the red area! THANKS!

Please help me with the red area! THANKS! A B D E

A B D E F G Atlantic Hurricanes 1 2 3 PLEASE clearly label every cell/column in your work. Empirical Probability 4 5 6 7 8 9 Number of Hurricanes in Frequency (# a Year of years) 0 5 1 16 2 19 3 14 4 3 5 5 6 4 7 3 8 2 9 0 10 Theoretical Probability =A5/$A$18 0.063 =A6/$A$18 0.105 =A7/$A$18 0.214 =A8/$A$18 1.333 =A9/$A$18 1.000 =A10/$A$18 1.500 =A11/$A$18 2.333 =A12/$A$18 4.000 =A13/$A$18 =A14/$A$18 10.000 =A15/$A$18 =A16/$A$18 12.000 =A17/$A$18 =A5/B5 =A6/B6 =A7/B7 =A8/B8 =A9/B9 =A10/B10 =A11/B11 =A12/B12 =A13/B13 0.013 0.026 0.038 0.051 0.064 0.077 0.090 0.103 0.115 0.128 0.141 0.154 11 12 13 14 15 O ON W =A15/B15 16 10 11 12 0 1 17 =A17/B17 78 18 19 Mean (Hint: this is group data) 2.96 =AVERAGE(D5:D 17) 20 21 22 23 24 25 26 27 28 29 30 31 32 33 34 35 36 a. Find the probabilities of 012 hurricanes each season using these data. b. Assuming a Poisson distribution and using the mean number of hurricanes per season from the empirical data, compute the probabilities of ex- periencing 012 hurricanes in a season. Compare these to your answer to part (a). How good does a Poisson distribution model this phenomenon? Construct a chart to visualize these results

Step by Step Solution

There are 3 Steps involved in it

1 Expert Approved Answer
Step: 1 Unlock blur-text-image
Question Has Been Solved by an Expert!

Get step-by-step solutions from verified subject matter experts

Step: 2 Unlock
Step: 3 Unlock

Students Have Also Explored These Related General Management Questions!