Question: Please help me with the Standard Deviation. Q1. (CAPM and expected returns) a. Given the following holding-period returns, , compute the average returns and the
Please help me with the Standard Deviation.
Q1.
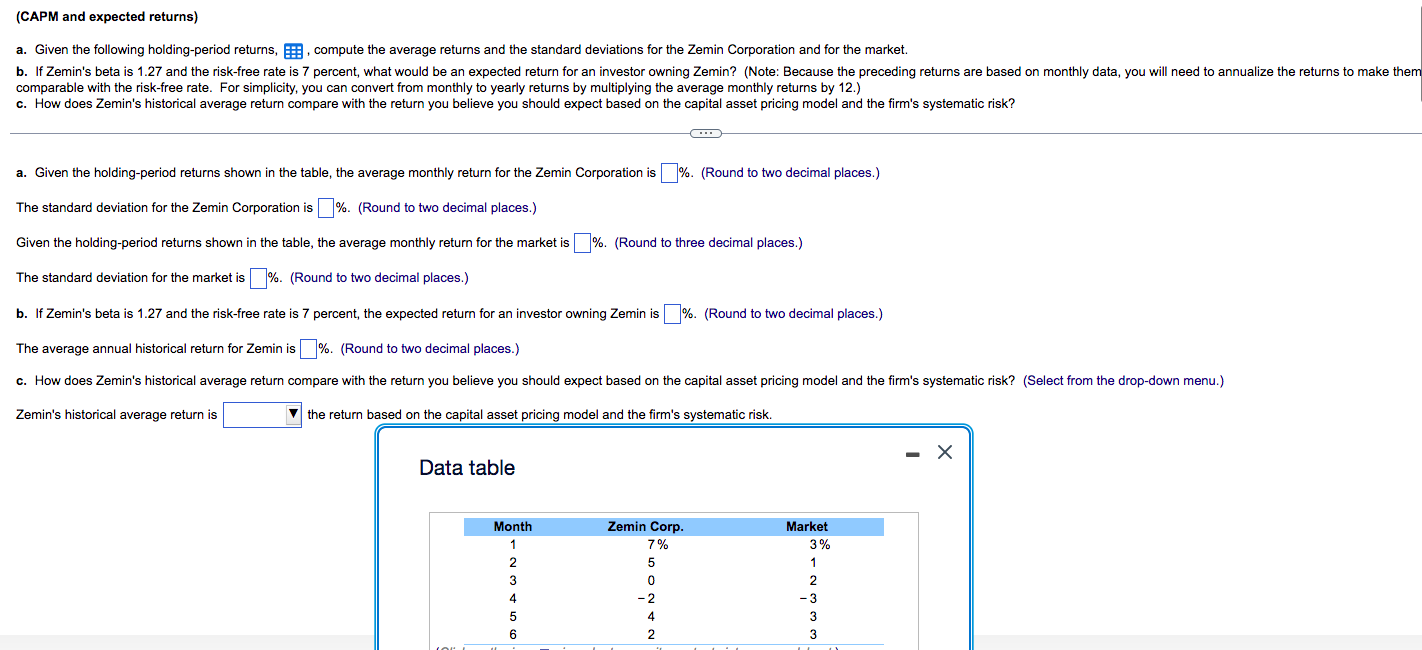
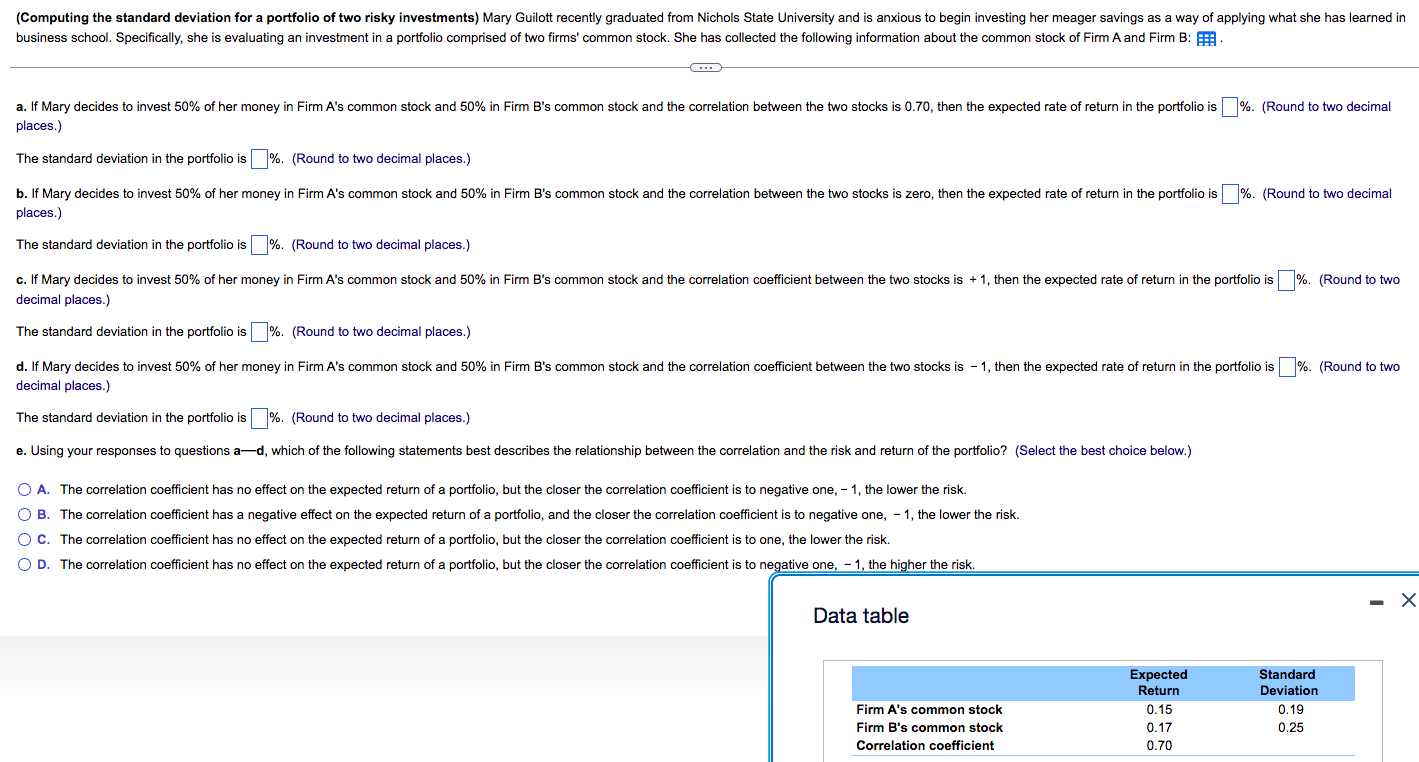
(CAPM and expected returns) a. Given the following holding-period returns, , compute the average returns and the standard deviations for the Zemin Corporation and for the market. b. If Zemin's beta is 1.27 and the risk-free rate is 7 percent, what would be an expected return for an investor owning Zemin? (Note: Because the preceding returns are based on monthly data, you will need to annualize the returns to make them comparable with the risk-free rate. For simplicity, you can convert from monthly to yearly returns by multiplying the average monthly returns by 12.) c. How does Zemin's historical average return compare with the return you believe you should expect based on the capital asset pricing model and the firm's systematic risk? a. Given the holding-period returns shown in the table, the average monthly return for the Zemin Corporation is %. (Round to two decimal places.) The standard deviation for the Zemin Corporation is |%. (Round to two decimal places.) Given the holding-period returns shown in the table, the average monthly return for the market is |%. (Round to three decimal places.) The standard deviation for the market is %. (Round to two decimal places.) b. If Zemin's beta is 1.27 and the risk-free rate is 7 percent, the expected return for an investor owning Zemin is |%. (Round to two decimal places.) The average annual historical return for Zemin is | %. (Round to two decimal places.) c. How does Zemin's historical average return compare with the return you believe you should expect based on the capital asset pricing model and the firm's systematic risk? (Select from the drop-down menu.) Zemin's historical average return is the return based on the capital asset pricing model and the firm's systematic risk. X Data table Month Zemin Corp. Market 7% 3% 5 OUAON- W WON- AND(Computing the standard deviation for a portfolio of two risky investments) Mary Guilott recently graduated from Nichols State University and is anxious to begin investing her meager savings as a way of applying what she has learned in business school. Specifically, she is evaluating an investment in a portfolio comprised of two firms' common stock. She has collected the following information about the common stock of Firm A and Firm B: FA a. If Mary decides to invest 50% of her money in Firm A's common stock and 50% in Firm B's common stock and the correlation between the two stocks is 0.70, then the expected rate of return in the portfolio is %. (Round to two decimal places.) The standard deviation in the portfolio is |%. (Round to two decimal places.) b. If Mary decides to invest 50% of her money in Firm A's common stock and 50% in Firm B's common stock and the correlation between the two stocks is zero, then the expected rate of return in the portfolio is %. (Round to two decimal places.) The standard deviation in the portfolio is %. (Round to two decimal places.) c. If Mary decides to invest 50% of her money in Firm A's common stock and 50% in Firm B's common stock and the correlation coefficient between the two stocks is + 1, then the expected rate of return in the portfolio is | %. (Round to two decimal places.) The standard deviation in the portfolio is %. (Round to two decimal places.) d. If Mary decides to invest 50% of her money in Firm A's common stock and 50% in Firm B's common stock and the correlation coefficient between the two stocks is - 1, then the expected rate of return in the portfolio is %. (Round to two decimal places.) The standard deviation in the portfolio is |%. (Round to two decimal places.) e. Using your responses to questions a-d, which of the following statements best describes the relationship between the correlation and the risk and return of the portfolio? (Select the best choice below.) A. The correlation coefficient has no effect on the expected return of a portfolio, but the closer the correlation coefficient is to negative one, - 1, the lower the risk. O B. The correlation coefficient has a negative effect on the expected return of a portfolio, and the closer the correlation coefficient is to negative one, - 1, the lower the risk. O C. The correlation coefficient has no effect on the expected return of a portfolio, but the closer the correlation coefficient is to one, the lower the risk. O D. The correlation coefficient has no effect on the expected return of a portfolio, but the closer the correlation coefficient is to negative one, - 1, the higher the risk. - X Data table Expected Standard Return Deviation Firm A's common stock 0.15 0.19 Firm B's common stock 0.17 0.25 Correlation coefficient 0.70
Step by Step Solution
There are 3 Steps involved in it
1 Expert Approved Answer
Step: 1 Unlock
Question Has Been Solved by an Expert!
Get step-by-step solutions from verified subject matter experts
Step: 2 Unlock
Step: 3 Unlock
Students Have Also Explored These Related Accounting Questions!