

Question: Please help me with these homework questions. For a data set of chest sizes (distance around chest in inches) and weights (pounds) of four anesthetized
Please help me with these homework questions.
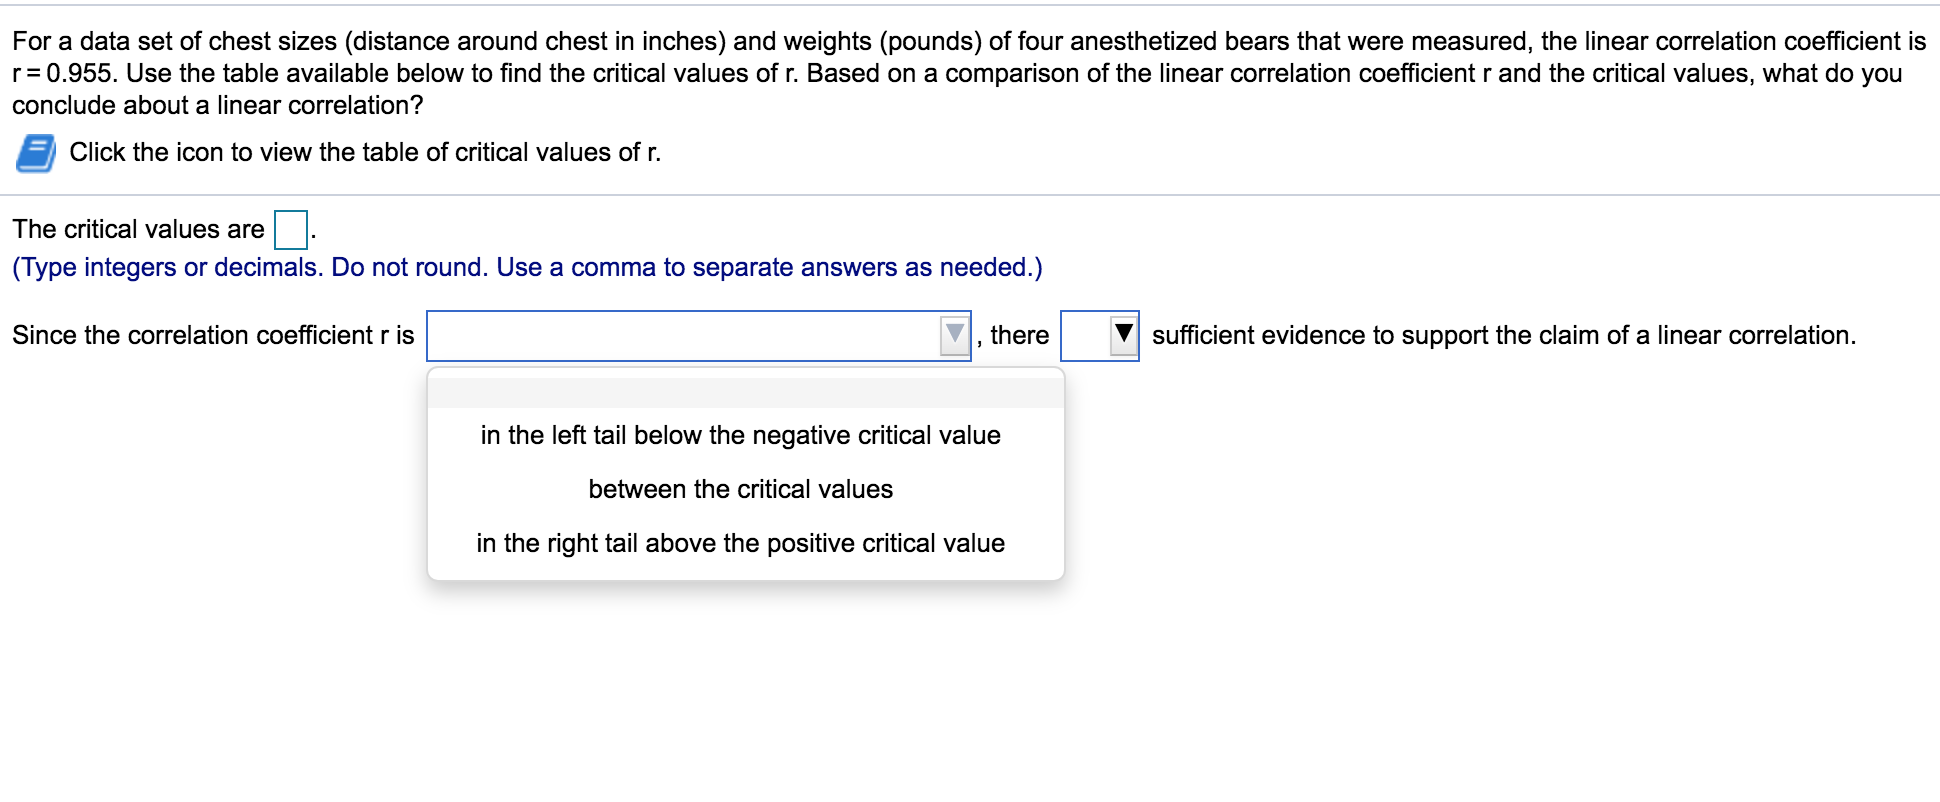
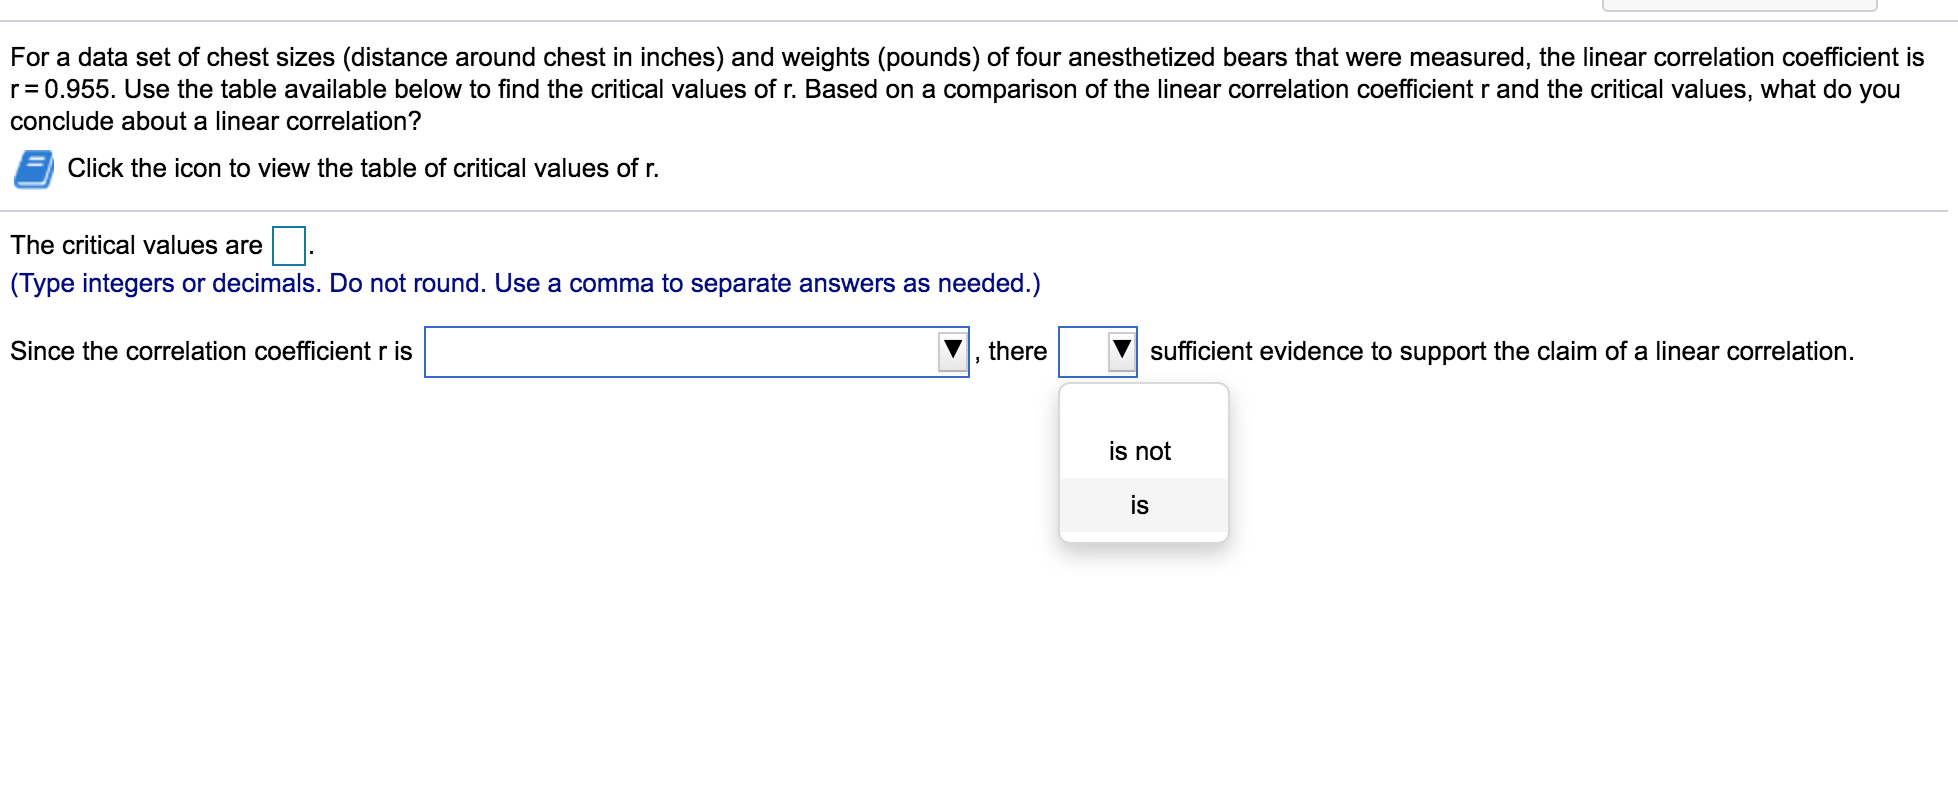
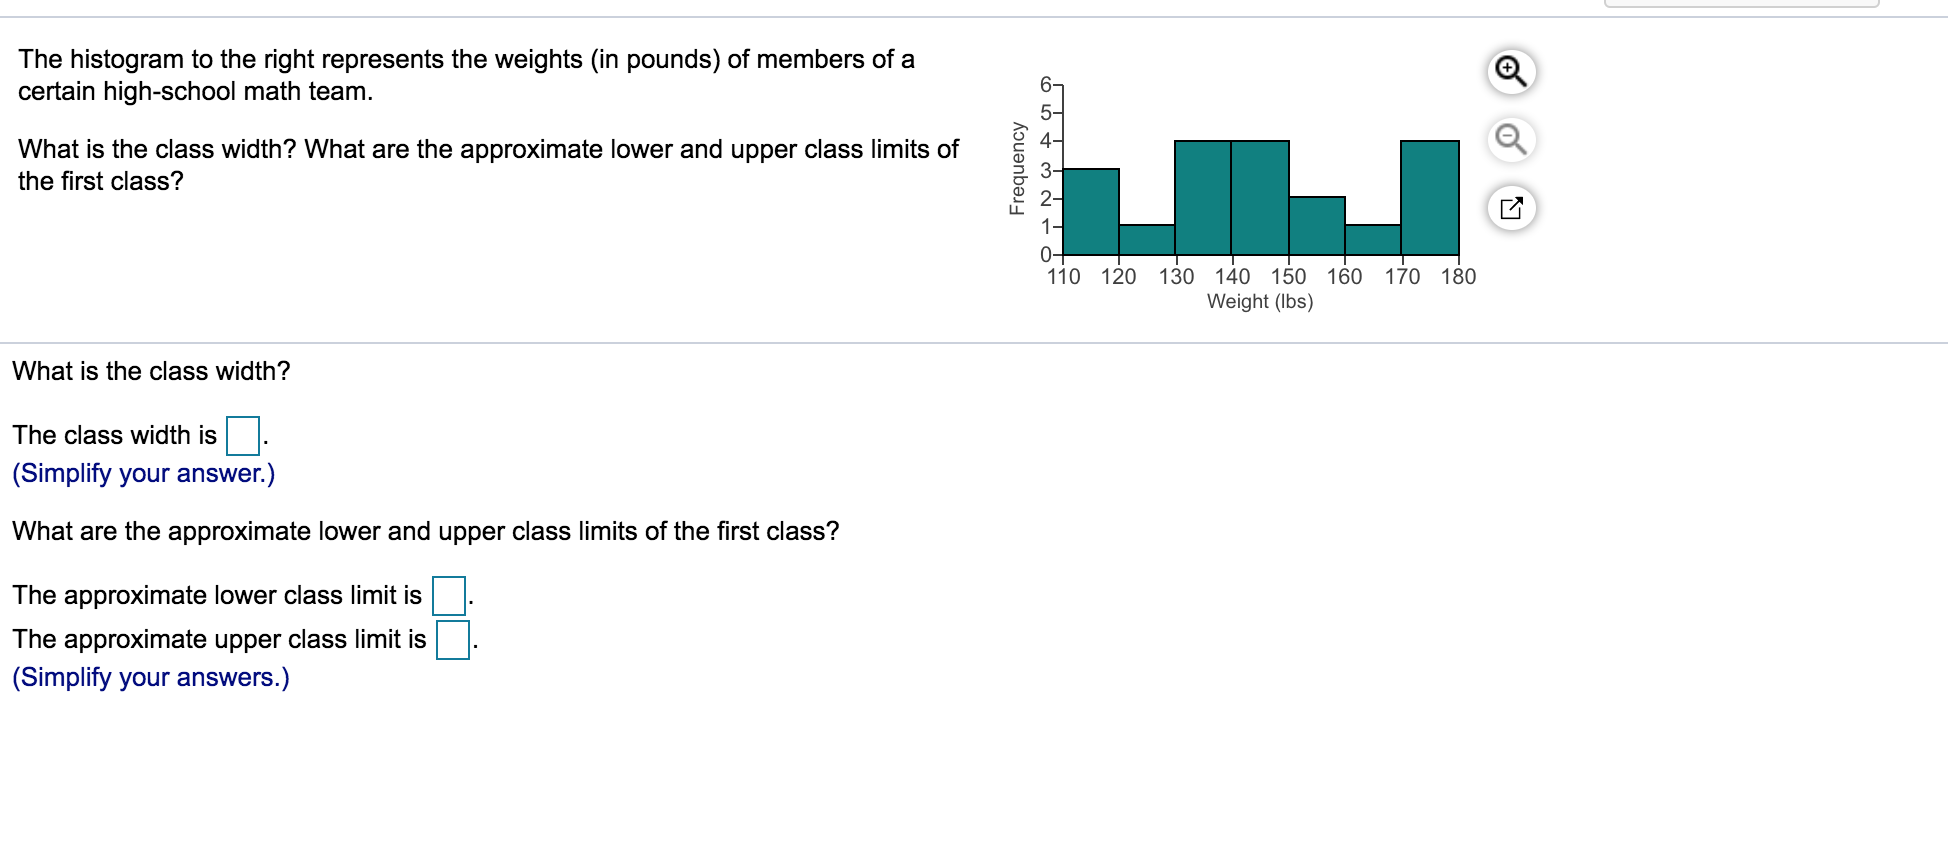
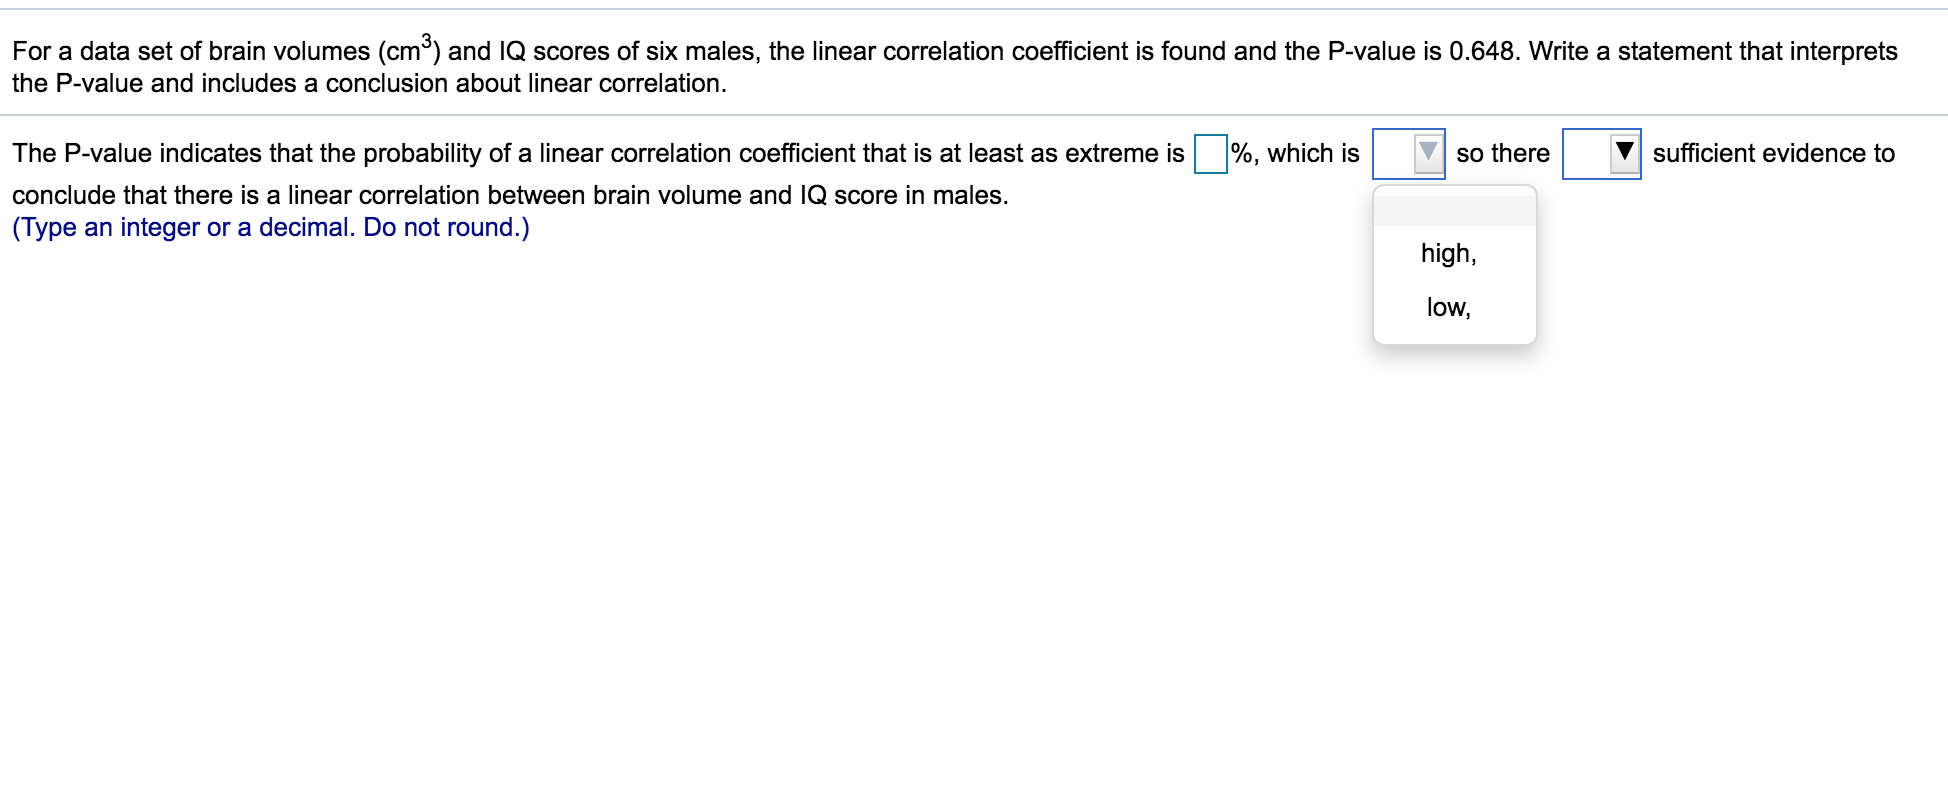
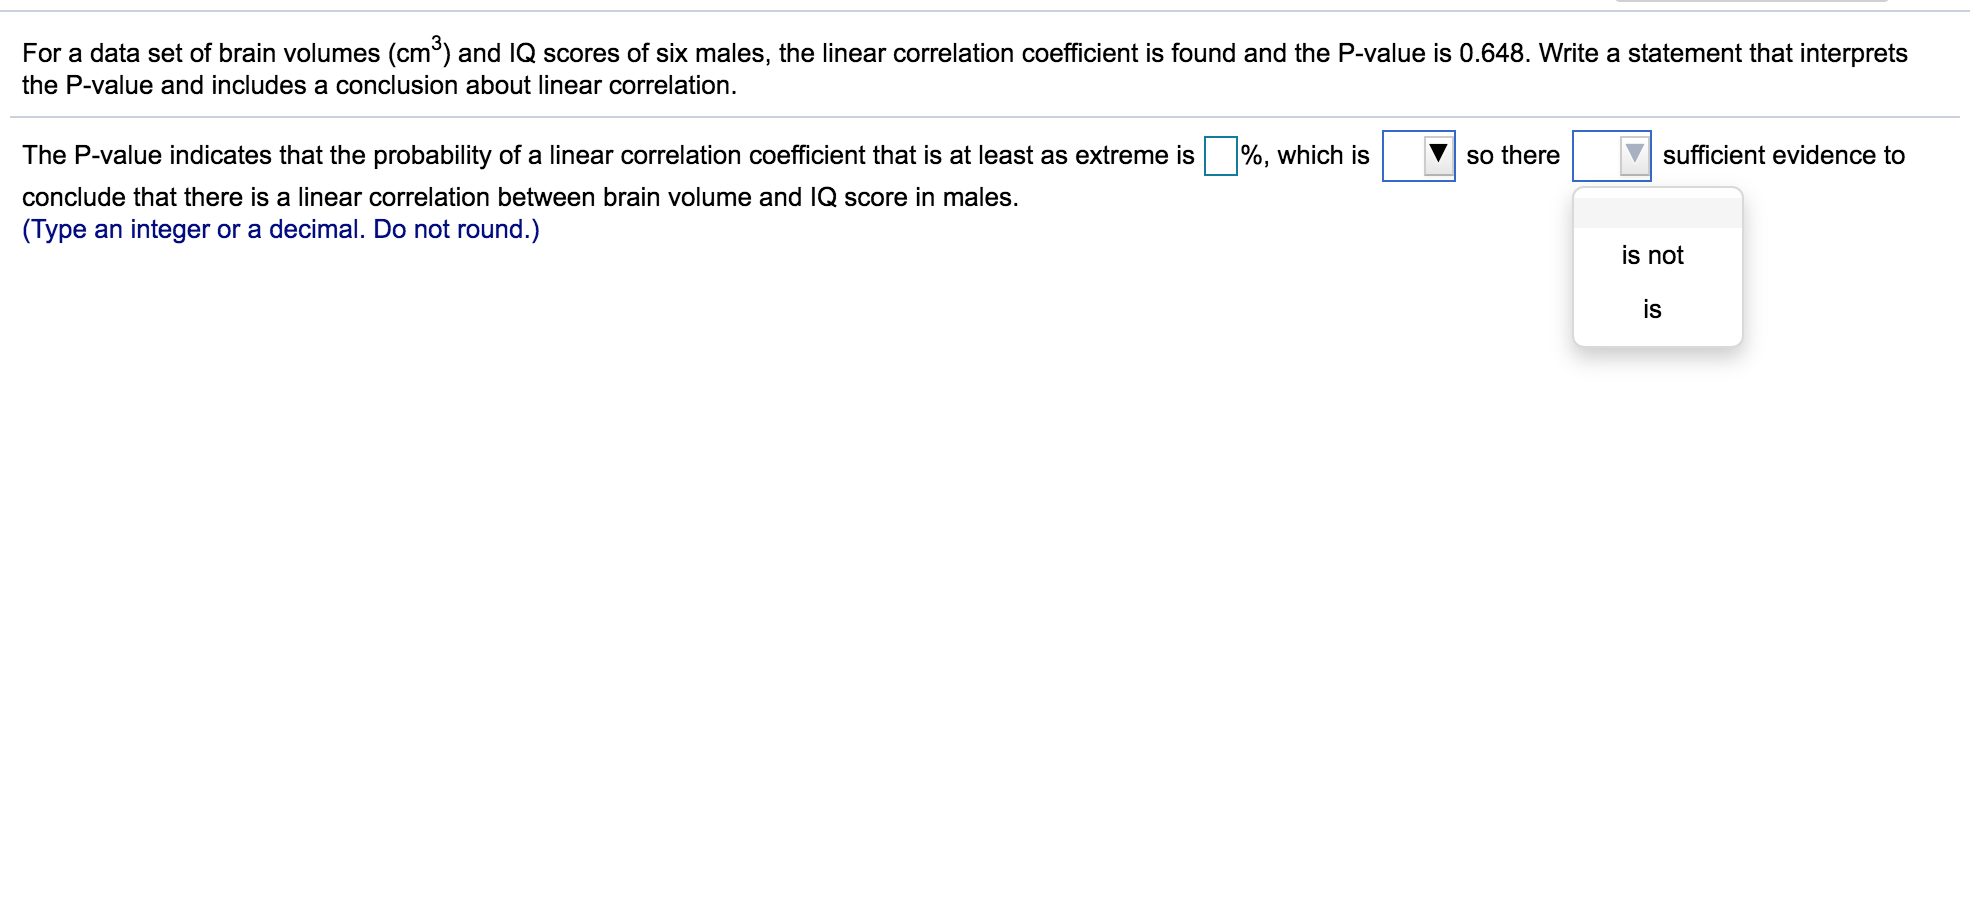
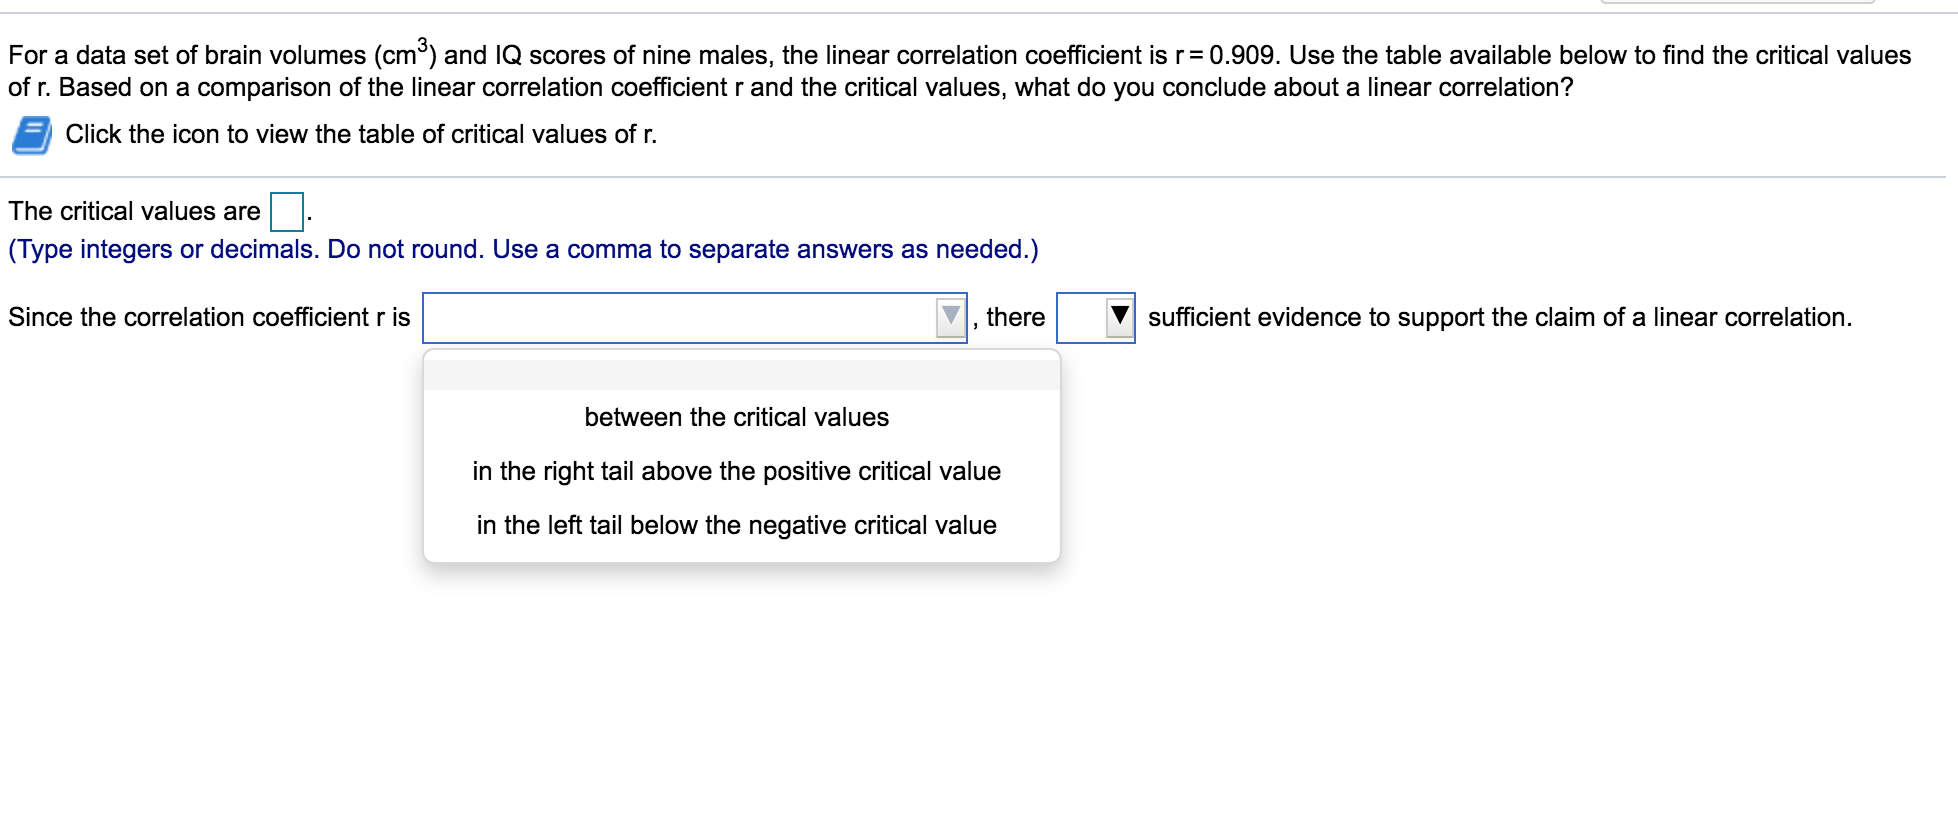
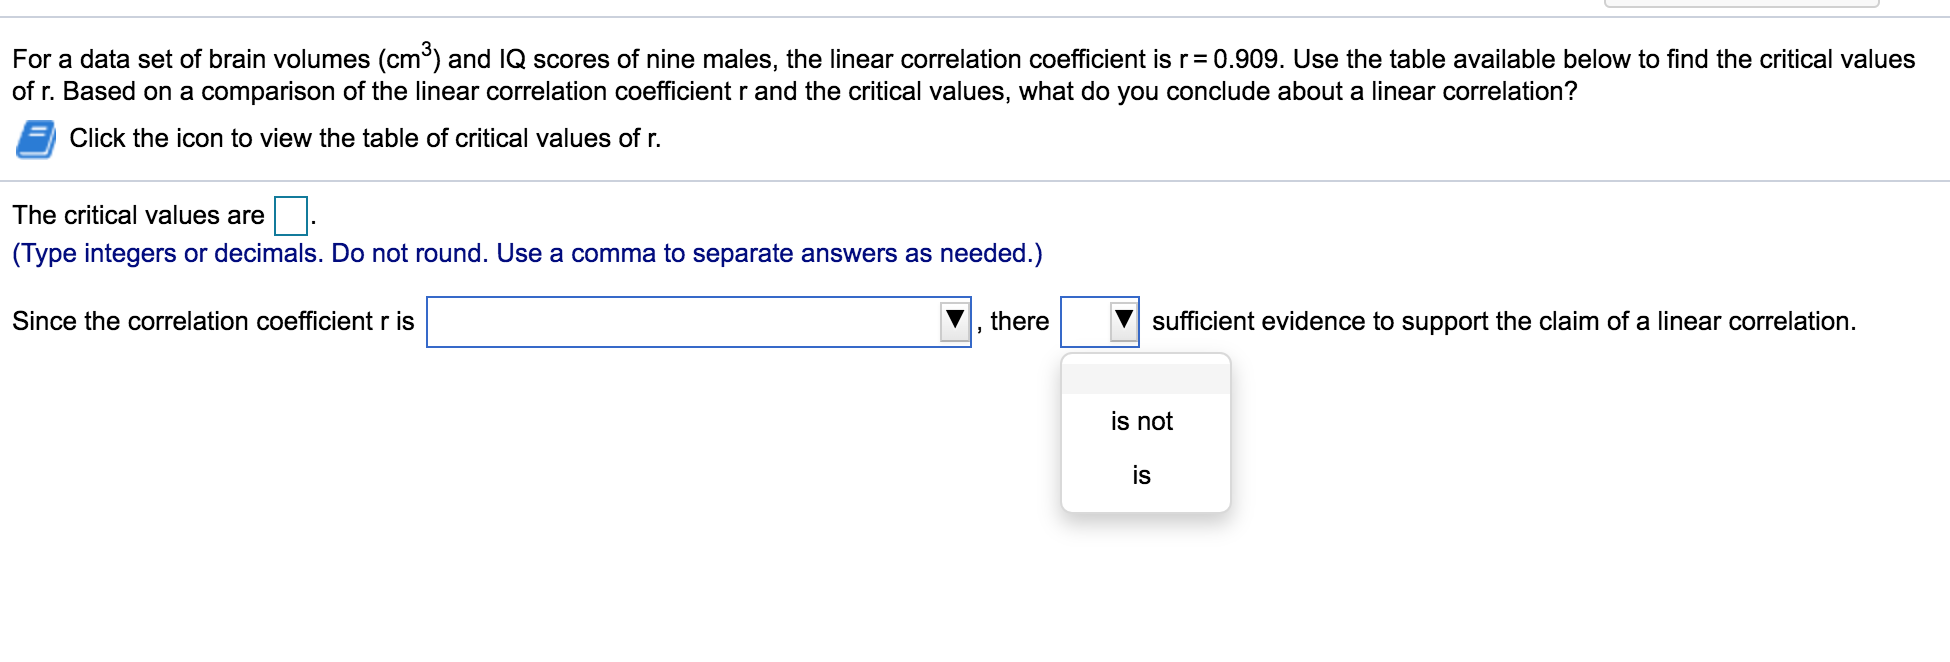
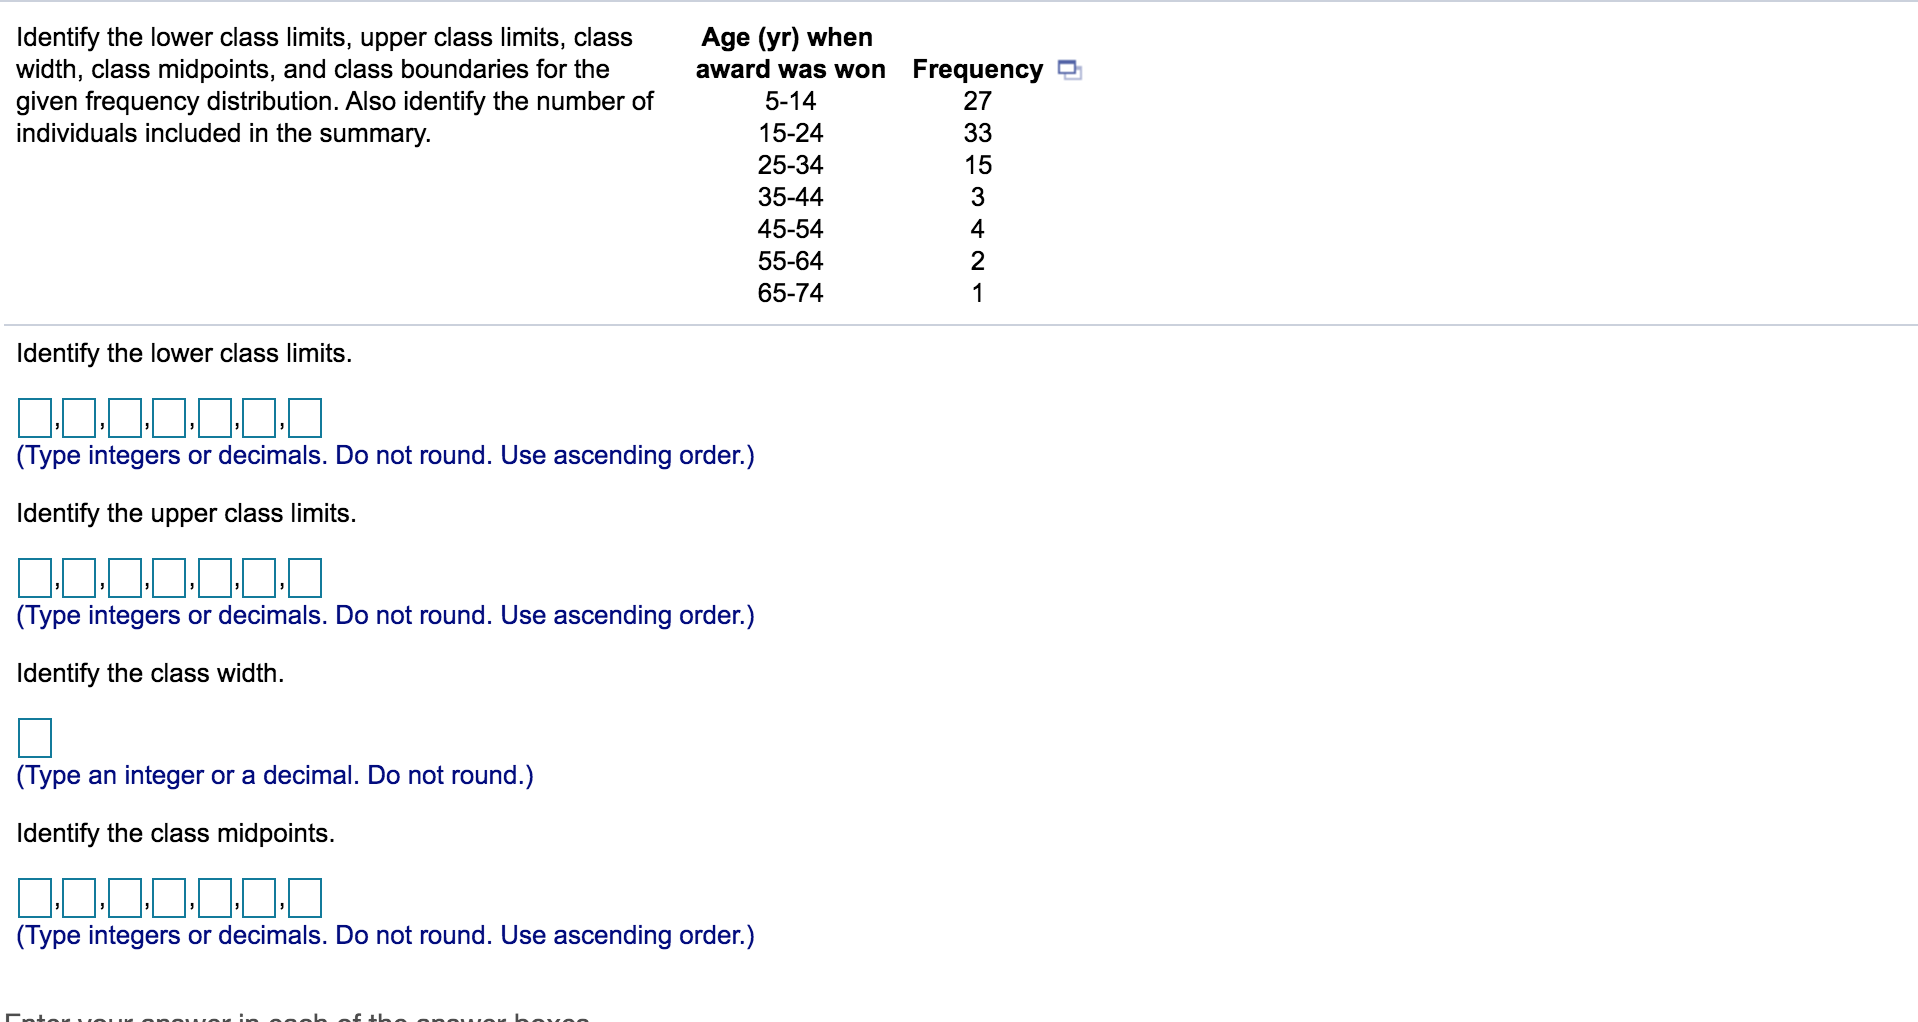
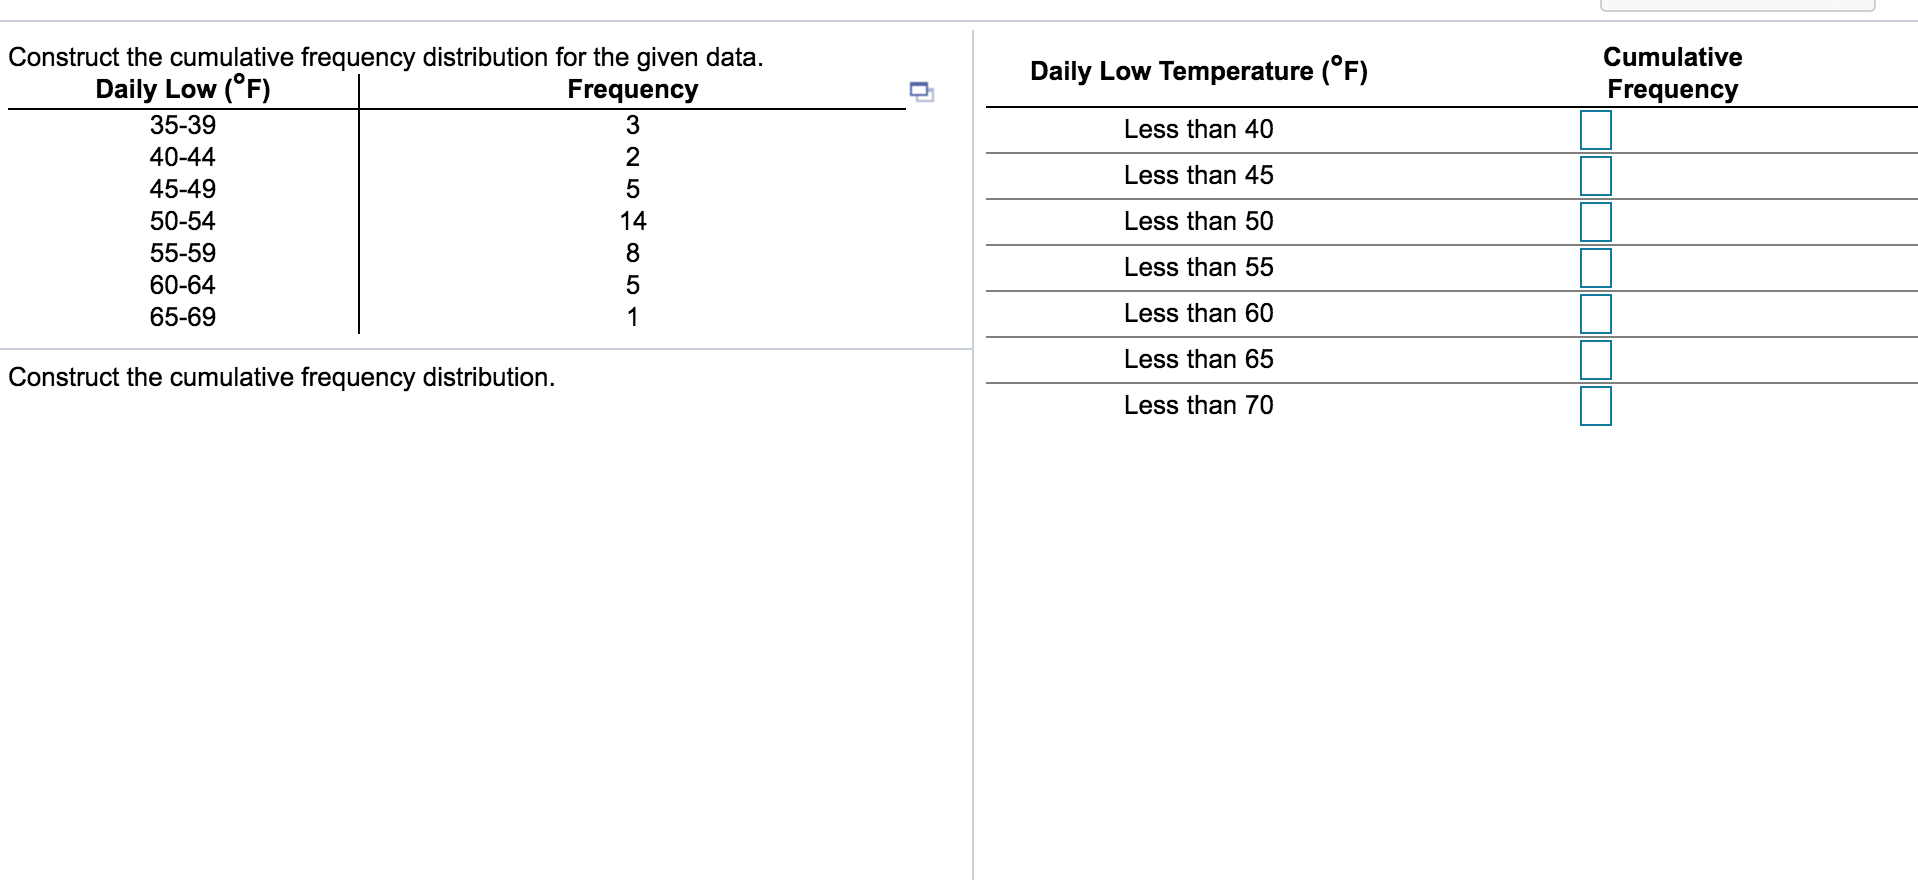
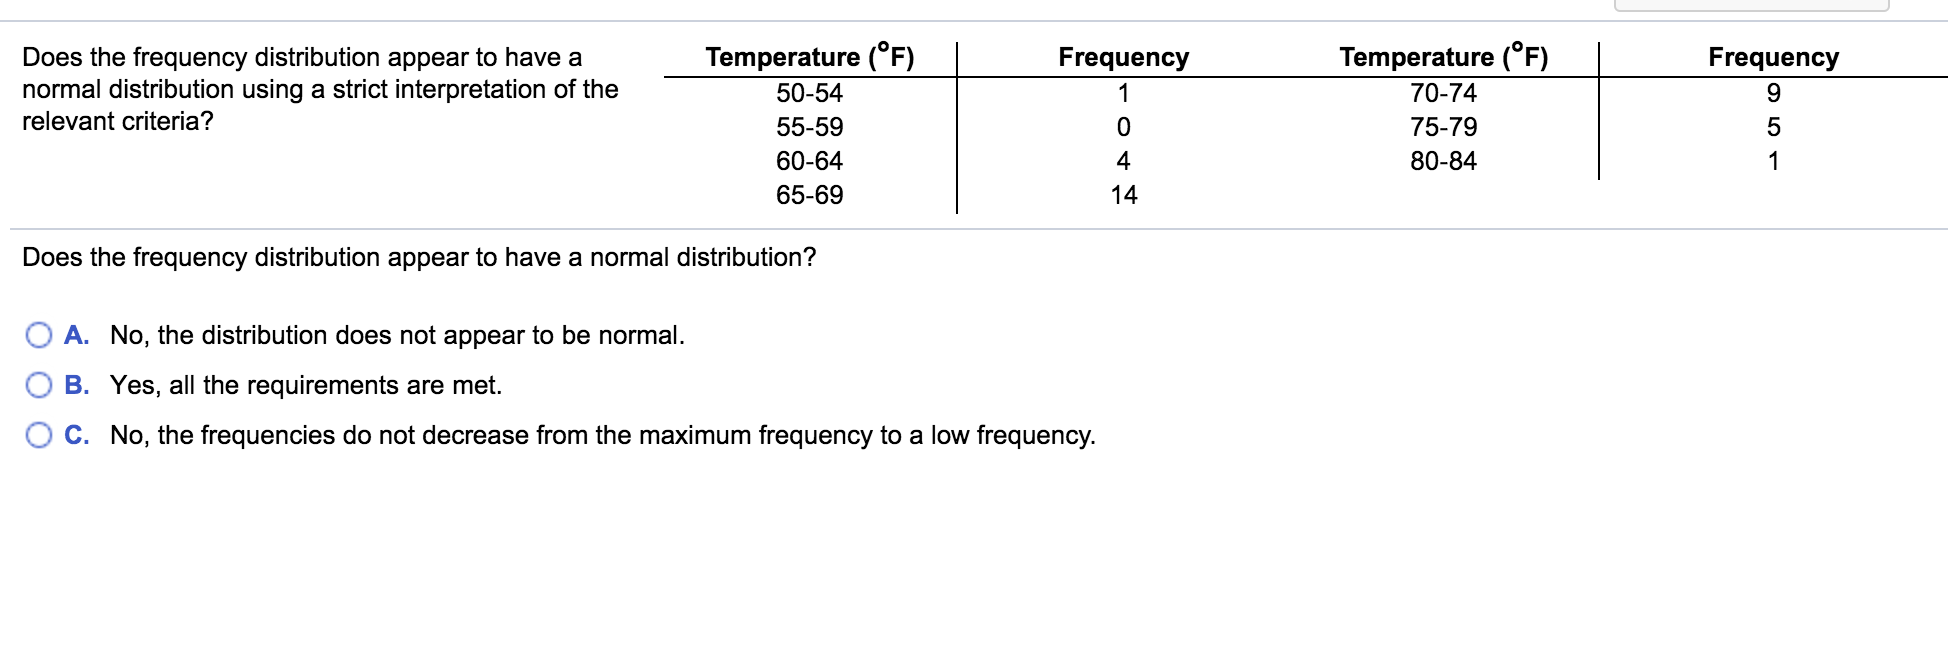
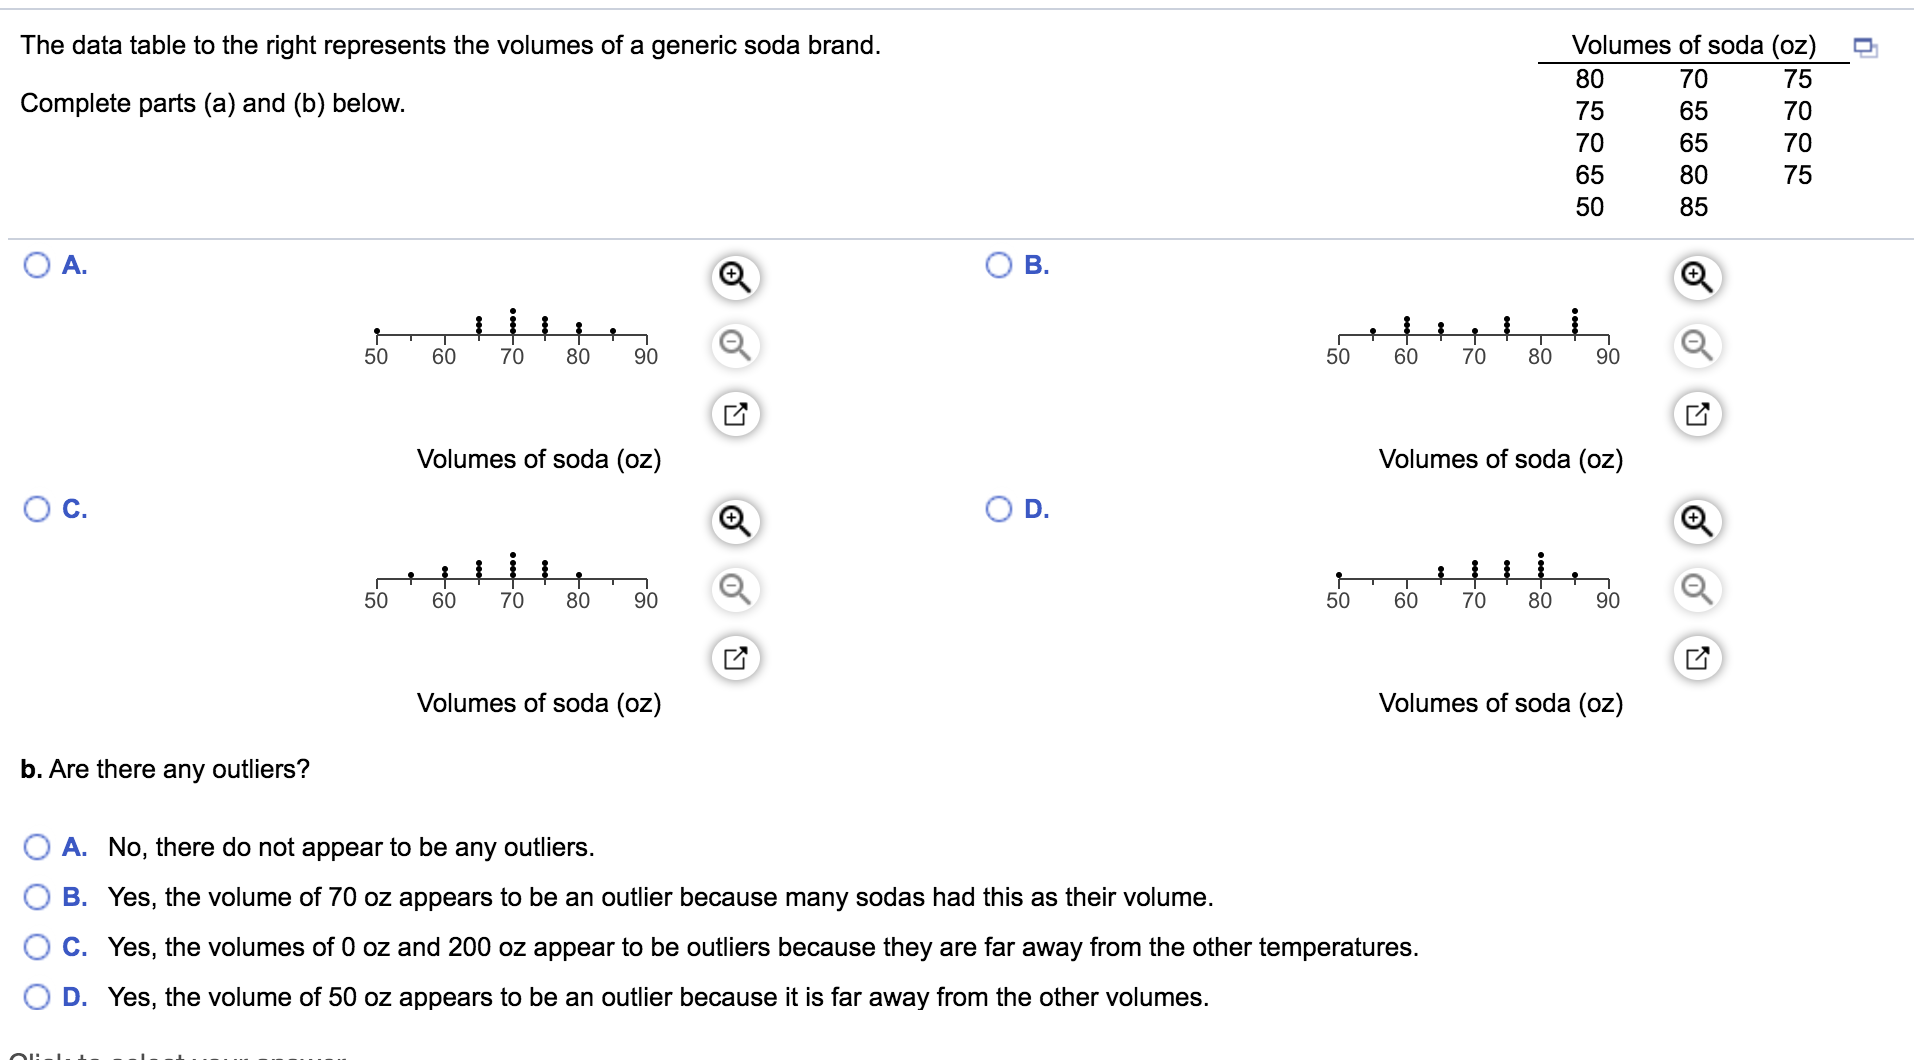
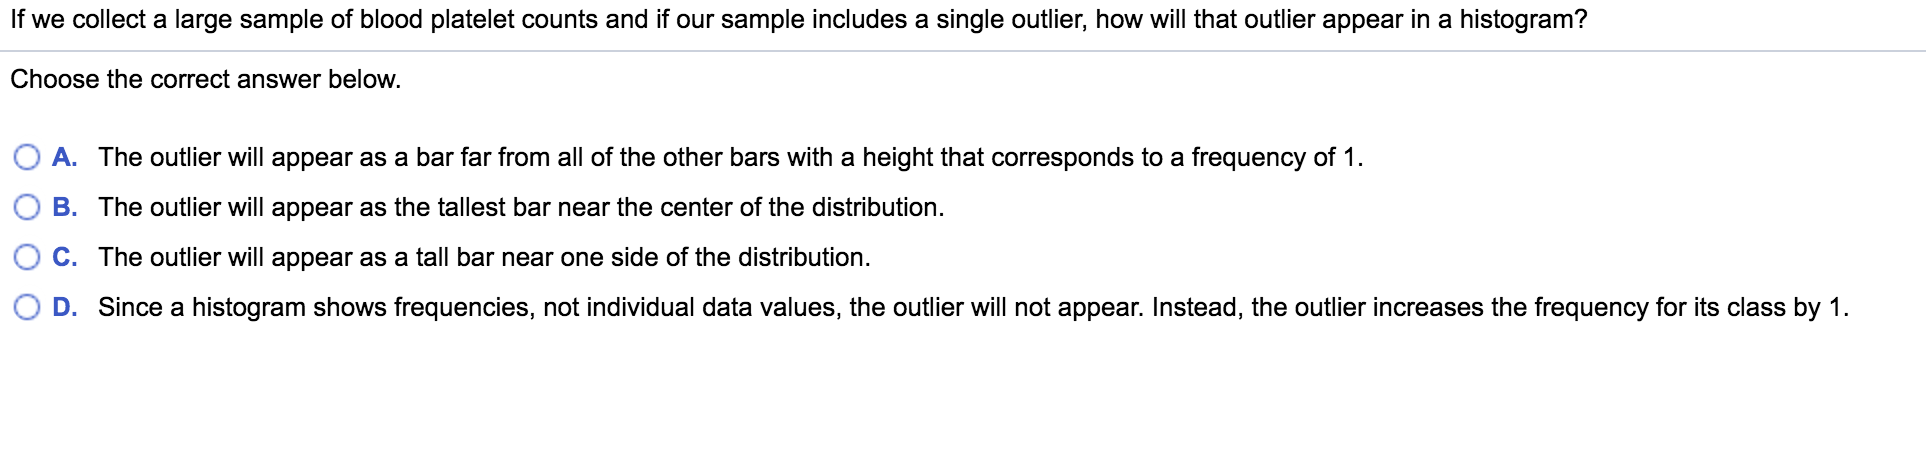
For a data set of chest sizes (distance around chest in inches) and weights (pounds) of four anesthetized bears that were measured, the linear correlation coefficient is r=0.955. Use the table available below to find the critical values of r. Based on a comparison of the linear correlation coefficient r and the critical values, what do you conclude about a linear correlation? Click the icon to view the table of critical values of r. The critical values are (Type integers or decimals. Do not round. Use a comma to separate answers as needed.) Since the correlation coefficient r is there sufficient evidence to support the claim of a linear correlation. in the left tail below the negative critical value between the critical values in the right tail above the positive critical valueFor a data set of chest sizes (distance around chest in inches) and weights (pounds) of four anesthetized bears that were measured, the linear correlation coefficient is r=0.955. Use the table available below to find the critical values of r. Based on a comparison of the linear correlation coefficient r and the critical values, what do you conclude about a linear correlation? Click the icon to view the table of critical values of r. The critical values are (Type integers or decimals. Do not round. Use a comma to separate answers as needed.) Since the correlation coefficient r is there sufficient evidence to support the claim of a linear correlation. is not isThe histogram to the right represents the weights (in pounds) of members of a certain high-school math team. What is the class width? What are the approximate lower and upper class limits of the first class? Frequency 110 120 130 140 150 160 170 180 Weight (Ibs) What is the class width? The class width is (Simplify your answer.) What are the approximate lower and upper class limits of the first class? The approximate lower class limit is The approximate upper class limit is (Simplify your answers.)For a data set of brain volumes (cm) and IQ scores of six males, the linear correlation coefficient is found and the P-value is 0.648. Write a statement that interprets the P-value and includes a conclusion about linear correlation. The P-value indicates that the probability of a linear correlation coefficient that is at least as extreme is |%, which is so there sufficient evidence to conclude that there is a linear correlation between brain volume and IQ score in males. (Type an integer or a decimal. Do not round.) high, low,For a data set of brain volumes (cm) and IQ scores of six males, the linear correlation coefficient is found and the P-value is 0.648. Write a statement that interprets the P-value and includes a conclusion about linear correlation. The P-value indicates that the probability of a linear correlation coefficient that is at least as extreme is %, which is so there sufficient evidence to conclude that there is a linear correlation between brain volume and IQ score in males. (Type an integer or a decimal. Do not round.) is not isFor a data set of brain volumes (cm) and IQ scores of nine males, the linear correlation coefficient is r= 0.909. Use the table available below to find the critical values of r. Based on a comparison of the linear correlation coefficient r and the critical values, what do you conclude about a linear correlation? Click the icon to view the table of critical values of r. The critical values are (Type integers or decimals. Do not round. Use a comma to separate answers as needed.) Since the correlation coefficient r is there sufficient evidence to support the claim of a linear correlation. between the critical values in the right tail above the positive critical value in the left tail below the negative critical valueFor a data set of brain volumes (cm ) and IQ scores of nine males, the linear correlation coefficient is r= 0.909. Use the table available below to find the critical values of r. Based on a comparison of the linear correlation coefficient r and the critical values, what do you conclude about a linear correlation? Click the icon to view the table of critical values of r. The critical values are (Type integers or decimals. Do not round. Use a comma to separate answers as needed.) Since the correlation coefficient r is there sufficient evidence to support the claim of a linear correlation. is not isIdentify the lower class limits, upper class limits, class Age (yr) when width, class midpoints, and class boundaries for the award was won Frequency given frequency distribution. Also identify the number of 5-14 27 individuals included in the summary. 15-24 33 25-34 15 35-44 45-54 55-64 65-74 - NA C Identify the lower class limits. 0.0.0.0.0.0.0 (Type integers or decimals. Do not round. Use ascending order.) Identify the upper class limits. 0.0.0.0.0.0.0 (Type integers or decimals. Do not round. Use ascending order.) Identify the class width. (Type an integer or a decimal. Do not round.) Identify the class midpoints. 0.0.0.0.0.0.0 (Type integers or decimals. Do not round. Use ascending order.)Construct the cumulative frequency distribution for the given data. Cumulative Daily Low Temperature (F) Daily Low (F) | Frequency E}. Frequency 35-39 3 Less than 40 40-44 2 4549 5 Less than 45 _ 50-54 14 Less than 50 55-59 8 _ 60-64 5 Less than 55 _ 65-69 1 Less than 60 Less than 65 Less than 70 Construct the cumulative frequency distribution. Does the frequency distribution appear to have a Temperature (F) Frequency Temperature (F) Frequency normal distribution using a strict interpretation of the 50-54 1 7074 9 relevant criteria? 55-59 0 75-79 5 60-64 4 80-84 1 6569 14 Does the frequency distribution appear to have a normal distribution? 0 A. No, the distribution does not appear to be normal. O B. Yes, all the requirements are met. 0 C. No, the frequencies do not decrease from the maximum frequency to a low frequency. The data table to the right represents the volumes of a generic soda brand. Complete parts (a) and (b) below. OA. leeIHlH 50 60 70 80 90 Volumes of soda (oz) 00. r+4L4JfT 50 60 7O 80 90 Volumes of soda (02) b. Are there any outliers? O A. No, there do not appear to be any outliers. O B. Yes, the volume of 70 02 appears to be an outlier because many sodas had this as their volume. Volumes of soda (oz) 80 75 70 65 50 r+4L+Jrl1 50 60 70 80 90 Volumes of soda (oz) hTL#JL+ 50 60 70 80 90 Volumes of soda (oz) 0 0. Yes, the volumes of 0 oz and 200 oz appear to be outliers because they are far away from the other temperatures. 0 D. Yes, the volume of 50 02 appears to be an outlier because it is far away from the other volumes. AI:_I_L_ __|__;. .._.... _.__..._.. 70 65 65 80 85 Q a 75 70 70 75 If we collect a large sample of blood platelet counts and if our sample includes a single outlier, how will that outlier appear in a histogram? Choose the correct answer below. 0 A. The outlier will appear as a bar far from all of the other bars with a height that corresponds to a frequency of 1. O B. The outlier will appear as the tallest bar near the center of the distribution. 0 C. The outlier will appear as a tall bar near one side of the distribution. 0 D. Since a histogram shows frequencies, not individual data values, the outlier will not appear. Instead, the outlier increases the frequency for its class by 1
Step by Step Solution
There are 3 Steps involved in it

Get step-by-step solutions from verified subject matter experts